HOT TOPICS LIST
- MACD
- Fibonacci
- RSI
- Gann
- ADXR
- Stochastics
- Volume
- Triangles
- Futures
- Cycles
- Volatility
- ZIGZAG
- MESA
- Retracement
- Aroon
INDICATORS LIST
LIST OF TOPICS
PRINT THIS ARTICLE
by Ron Walker
As the Nikkei rises to test its down trendline, will it get a reversal at resistance? Or will prices break out? A technical litmus test should be applied to any breakout to determine if it is legitimate.
Position: N/A
Ron Walker
Ron Walker is an active trader and technical analyst. He operates an educational website dedicated to the study of Technical Analysis. The website offers free market analysis with daily video presentations and written commentaries. Ron is a video pioneer, being one of the first to utilize the internet producing Technical Analysis videos. His website is thechartpatterntrader.com
PRINT THIS ARTICLE
TECHNICAL ANALYSIS
The Nikkei's Technical Litmus Test?
04/09/08 09:11:10 AMby Ron Walker
As the Nikkei rises to test its down trendline, will it get a reversal at resistance? Or will prices break out? A technical litmus test should be applied to any breakout to determine if it is legitimate.
Position: N/A
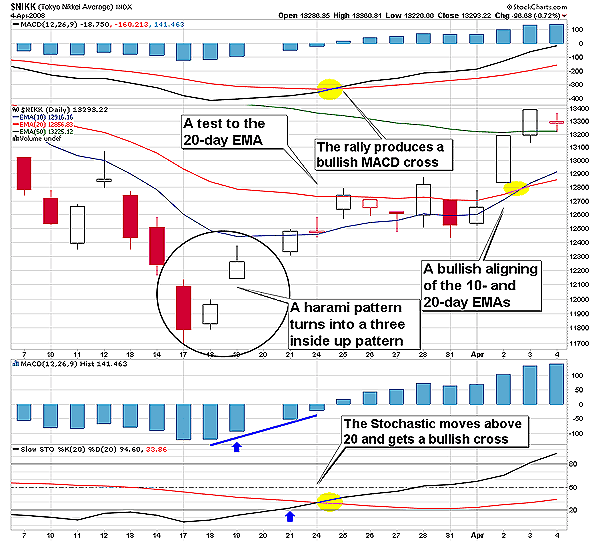
| The bullish rally on the Tokyo Nikkei ($NIKK) began on March 18 with a harami. This bullish two-day candlestick pattern requires that the first day of the pattern completely engulf the second day. Once prices close above the peak of the pattern, it confirms the harami and then becomes a three inside-up pattern. The harami looks very similar to an inside day. The difference is that the harami is only concerned with the real body, which is the open and closing prices. The second day's body must open and close within the first day's real body, but an inside day uses high and low prices in its pattern. In Figure 1, the upside journey started at the opening of the following day, when on March 19 prices gapped up at the open, completing a three inside-up candlestick pattern. This bottom on the Nikkei corresponded with the bottom that occurred in the US stock market. The breakout of the three-day candlestick pattern led the way to a recovery for an oversold stochastic (20,20), as the stochastic line crossed above its signal line that same day. The moving average convergence/divergence (MACD) histogram (12,26,9) also showed prospects of higher prices, producing a higher closing bar. This brought about a divergence between the Nikkei and the MACD histogram (Figure 2). In addition, bullish forces were at work, allowing prices to surge on March 21 as the slow stochastic (20,20) rose sharply above the oversold levels of 20. Just three days after the three inside-up candlestick pattern occurred, prices increased to test the 20-day exponential moving average (EMA), while simultaneously the MACD (12,26,9) line crossed above its signal line. The MACD histogram (12,26,9) was equally as positive, as that day's bar rose above the value of zero into positive territory and the stochastic (20,20) line edged above the value of 50. Consequently, this allowed for a bullish divergence to appear on the MACD (12,26, 9), which coincides with the multiple points of positive divergence on the relative strength index (RSI) (14). |

|
| FIGURE 1: TOKYO NIKKEI AVERAGE ($NIKK), DAILY. The Nikkei produced a bullish harami candlestick pattern that evolved into a three-day inside-up pattern the following day. Prices then rose to test the 20-day EMA, allowing a bullish cross of the MACD and the slow stochastic (20, 20) to occur. Shortly after that, there was a bullish realignment of the 10- and 20-day EMAs. |
| Graphic provided by: StockCharts.com. |
| |
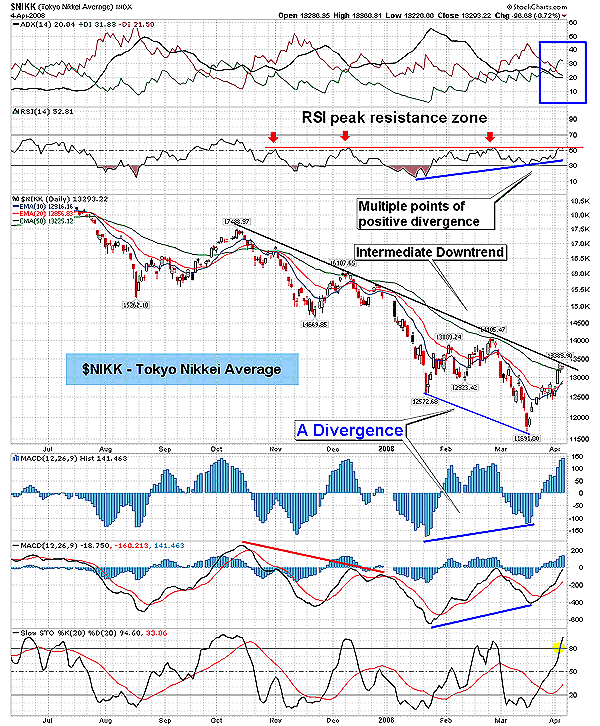
| In Figure 2, after a brief consolidation, prices gapped above the 20-day EMA to test the 50-day EMA on April 2. This occurred in sync with the average directional movement indicator (ADX) (14) becoming bullish, poised as the positive directional movement (+DI) line crossed above the -DI line. The next day, the advance moved prices above the 50-day EMA, running into resistance at the declining trendline from the October high. The attempt to test the declining trendline created such momentum in price movement that it choreographed a bullish aligning of the 10- and 20-day EMAs, which is one of characteristics of the early stages of a trend. The move also allowed the slow stochastic (20, 20) to become newly overbought. Markets have a tendency of staying overbought in the early development of a trend. But buying the Nikkei at key resistance, once it becomes overbought, could prove dangerous, given the Nikkei's recent run up of 11%. We need evidence that the trend is truly changing before we can render a verdict. Any decision to buy the Nikkei at this level should come under extreme scrutiny, as some tough questions need to be answered. Can prices close above the highest peak made on the day when the slow stochastic (20, 20) first became overbought? Can prices muster up the strength to close above the declining trendline? Will the ADX line on the ADX (14) be able to cross above the negative -DI line? Can the RSI (14) exceed previous peaks of resistance and go higher? |

|
| FIGURE 2:TOKYO NIKKEI AVERAGE ($NIKK), DAILY. The stochastic (20,20) became newly overbought (highlighted in yellow) as prices tested the declining trendline. Prices must close above the highest peak made on the day when the slow stochastic (20, 20) first became overbought. That would trigger an entry point with a close above 13,389. That would break the downtrend, allowing the trend incators to thrive, as the ADX line could cross above the -DI line, while the MACD moved into positive territory. |
| Graphic provided by: StockCharts.com. |
| |
| Let me first say that buying overbought markets can be tricky. However, buying overbought markets can be extremely profitable in the early stages of a trend. But wait for prices to close above the highest peak that was made, the day when they first registered as overbought (a move above 80) on the stochastic (20,20). So the highest high that occurred the day in which the stochastic (20,20) first became overbought is the benchmark. Prices must exceed and close above that level before considering buying the Nikkei at these overbought levels. The next consideration should be given to the resistance of downtrend. Great priority should always be placed on an intermediate trendline whenever considering an entry point. If prices decisively break above 13,389 on the Nikkei, the downtrend will be broken. When a downtrend breaks, it signals that a market that was previously dominated by sellers is now being overrun by buyers, suggesting a shifting of the balance of power. Positions can be taken on a decisive breakout of a trendline with strong volume, or sometimes a trader waits for a follow-through. When a trendline breaks, the usual consequences of either price consolidation or a retracement will occur. Consolidation transpires after the breakout in order to build the necessary momentum to build a new trend. If prices start the process of retracing lost ground, they should begin testing several points of resistance. If prices break above the trendline, there is a high probability that the move will be accompanied by the ADX line rising off its low, and crossing above the lower -DI line. Incidentally, the ADX would need to move above its current level of 20 in order to effectively change the trend. |
| Accordingly, the RSI(14) has now reached peaks that have previously acted as resistance throughout the downtrend. If prices begin to falter, turning lower and then get a bounce once the rising RSI trendline has been tested, it may be the catalyst that ignites the index to break out. That would create another point of positive divergence on the RSI (14) off the original reference low made last January. Multiple points of long-term bullish divergences develop on the RSI (14) right before a trend changes, just as they are right now. That gives further weight to a case for higher prices. The breakout of the downtrend should cause the RSI to move above the value of 66.67, which would trigger a buy signal. An RSI reading of 66.67 marks the point when the RSI ratio shifts to two to one in favor of the bulls — meaning the amount of up days is twice the amount of the down days. This is why a stock in a downtrend usually cannot move above 66.67. Note that during the entire downtrend on Nikkei ($NIKK), the RSI never moved above 66.67. Now, should any of these technical events that we just discussed transpire, then it may start a chain reaction that could propel the Nikkei ($NIKK) higher. It is in a trader's best interest to try and recognize a trend at its earliest possible stages in order to ensure an early entry point. But make sure the Nikkei passes the litmus test before you jump on the bandwagon. |
Ron Walker is an active trader and technical analyst. He operates an educational website dedicated to the study of Technical Analysis. The website offers free market analysis with daily video presentations and written commentaries. Ron is a video pioneer, being one of the first to utilize the internet producing Technical Analysis videos. His website is thechartpatterntrader.com
| Website: | thechartpatterntrader.com |
| E-mail address: | thechartpatterntrader@gmail.com |
Click here for more information about our publications!
Comments
Date: 04/09/08Rank: 1Comment:

Request Information From Our Sponsors
- StockCharts.com, Inc.
- Candle Patterns
- Candlestick Charting Explained
- Intermarket Technical Analysis
- John Murphy on Chart Analysis
- John Murphy's Chart Pattern Recognition
- John Murphy's Market Message
- MurphyExplainsMarketAnalysis-Intermarket Analysis
- MurphyExplainsMarketAnalysis-Visual Analysis
- StockCharts.com
- Technical Analysis of the Financial Markets
- The Visual Investor
- VectorVest, Inc.
- Executive Premier Workshop
- One-Day Options Course
- OptionsPro
- Retirement Income Workshop
- Sure-Fire Trading Systems (VectorVest, Inc.)
- Trading as a Business Workshop
- VectorVest 7 EOD
- VectorVest 7 RealTime/IntraDay
- VectorVest AutoTester
- VectorVest Educational Services
- VectorVest OnLine
- VectorVest Options Analyzer
- VectorVest ProGraphics v6.0
- VectorVest ProTrader 7
- VectorVest RealTime Derby Tool
- VectorVest Simulator
- VectorVest Variator
- VectorVest Watchdog
