HOT TOPICS LIST
- MACD
- Fibonacci
- RSI
- Gann
- ADXR
- Stochastics
- Volume
- Triangles
- Futures
- Cycles
- Volatility
- ZIGZAG
- MESA
- Retracement
- Aroon
INDICATORS LIST
LIST OF TOPICS
PRINT THIS ARTICLE
by Ron Walker
The ADX triggered several great entry points on General Electric, but which one offered the best entry point for a short-term swing trade?
Position: Hold
Ron Walker
Ron Walker is an active trader and technical analyst. He operates an educational website dedicated to the study of Technical Analysis. The website offers free market analysis with daily video presentations and written commentaries. Ron is a video pioneer, being one of the first to utilize the internet producing Technical Analysis videos. His website is thechartpatterntrader.com
PRINT THIS ARTICLE
STRATEGIES
General Electric's ADX Signals
04/07/08 11:43:54 AMby Ron Walker
The ADX triggered several great entry points on General Electric, but which one offered the best entry point for a short-term swing trade?
Position: Hold
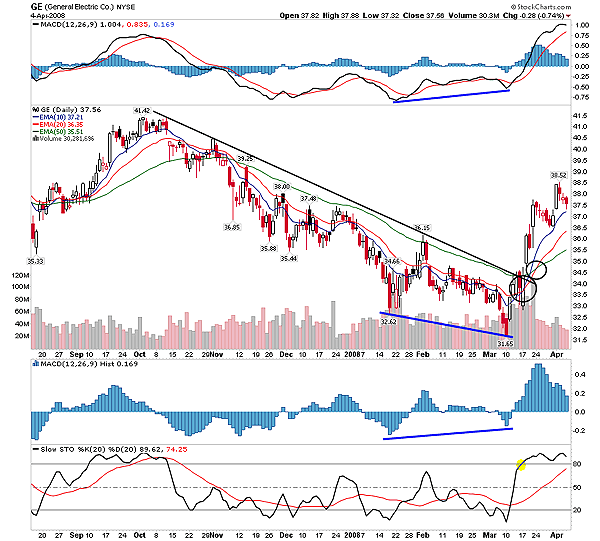
| Figure 1 shows that General Electric (GE) had been in a downtrend since early October, when finally on March 10 prices found a bottom just above $31. The following day, prices gapped higher as an elongated candlestick reversed a three-day losing streak. This produced a divergence between price and the moving average convergence/divergence (MACD) histogram. Just two days after the bottom had been made, the divergence played out as a MACD histogram bar moved above zero into positive territory. This occurred simultaneously as prices climbed even higher moving above the 20-day exponential moving average (EMA) where they tested the declining intermediate trendline. This caused the positive directional movement indicator (+DI) to cross above the negative directional movement indicator (-DI) on the average direction indicator (ADX) (Figure 2). When the ADX has a crossover with one directional line (DI) moving above the other, it is time to consider trading in a new direction. Prices then underwent a four-day consolidation period. On March 17, the last day of the consolidation, prices closed above the intermediate trendline. The next morning prices gapped higher again, moving above resistance at 34.75, decisively moving above the declining trendline. Prices rallied on huge volume that day, catapulting to the next level of resistance at 36.15. It also marked the first time in which the 10-day EMA crossed above the 20-day EMA since the downtrend began in October. Figure 2 shows that the bullish moving average crossover strengthened the stock further, as prices sat right below the confirmation line of a double bottom pattern which was at $36.15. The confirmation line is the highest point between the two bottoms. The double bottom conveyed the possibility of further upside potential for the stock. An objective target can be found for the double-bottom pattern by subtracting the highest point from the lowest point in the pattern. Then take the difference and add it to the confirmation line, which in the case of GE measured to $4.50 with a target of $40.65. |

|
| FIGURE 1: GE, DAILY. After a bottom formed on March 10 in GE, a divergence between price and the MACD histogram broke the intermediate trendline. After that the stochastic became newly overbought, while the 10-day EMA crossed above the 20-day EMA. Soon, both EMAs moved above the 50-day EMA, which further strengthened the stock. |
| Graphic provided by: StockCharts.com. |
| |
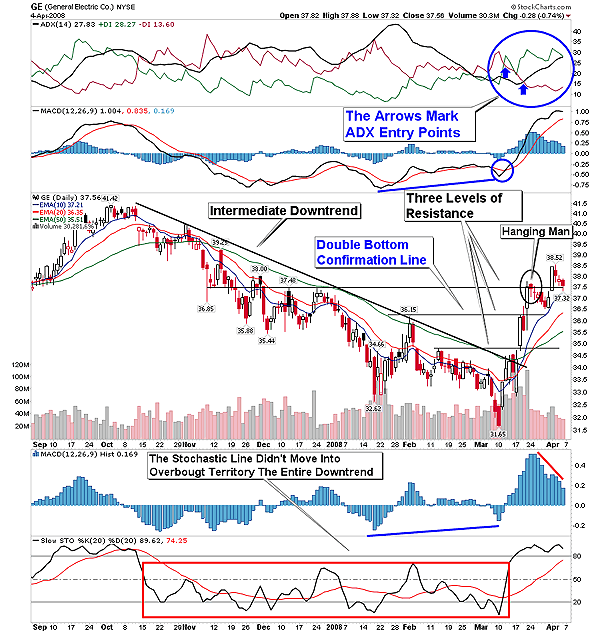
| The bulls were encouraged when on March 20 the double bottom broke out. This coincided with a powerful move in the average directional movement index (ADX) (14), which pulled above the negative direction movement line (-DI), while the positive directional movement line (+DI) was above both of them, suggesting a rising trend. Prices then ran out steam on March 24 as a hanging man candlestick pattern appeared. While the advance momentarily stalled, another significant event took place on the ADX (14). The ADX line had moved over four steps above its lowest point. When this occurs while the ADX is below both directional lines, it is an indication that a new trend is emerging. This is the strongest signal that the ADX can give that a trend is about to change. By March 24 the ADX had risen more than four steps off its low point from 14.66 to 19.04. From there, prices successfully backtested the breakout of the double-bottom pattern, finding support at the 10-day EMA. That built enough momentum to cause prices to gap up once again, exceeding the previous high. |

|
| FIGURE 2: GE, DAILY. A reversal occurred once a bottom formed on GE, triggering an early entry signal on the ADX long before the downtrend broke. Using the extreme point rule would have triggered a long position shortly before the double-bottom pattern on GE broke out. |
| Graphic provided by: StockCharts.com. |
| |
| There are three approaches a trader could have used to take a long position on GE using the ADX. A trader could have taken a position when the +DI crossed above the -DI. That would have gotten a trader long on March 12 around $34. The next strategy he could have used on the ADX was what Steve Achelis has dubbed the "extreme point rule" in his book Technical Analysis From A To Z. This technique records the highest price of the day as the extreme point, when the +DI crosses above -DI. So the extreme point entry would have been triggered with a close above $34.46. On March 18, prices gapped up, closing at $36.14. That would have allowed a trader to open a long position using the extreme point rule somewhere near $36. Our last trading technique would have had a trader wait until March 24 to place a trade, when the ADX (14) climbed four steps above its low of 14.66. We'll call this the four-point rule for simplicity. That would have put the trader long near the $37 area. |
| So which trading strategy was the best choice? In this case, the first method that was signaled when the +DI line crossed above the -DI line clearly offered the best entry point at $34. But often this methodology can lead to short-term losses before the trade turns profitable. In this trade, however, the lowest close during the following three days after the position was taken was only $33.82. The trader would have only had to deal with negative intraday price fluctuations of the position, which remained above the last minor low. Using the extreme point rule would have offered the second-best entry point, having the trader long just before the double-bottom pattern broke out and just after the 10-day EMA crossed above the 20-day EMA. That provided the trader with another source of confirmation to take the trade. Ironically, the last position proved to be the riskiest for a short-term trade, having to take a position after prices already rose by $6 and increased by almost 20% from the March 10th bottom of $31.65. Usually the four-point rule offers a better entry point than the one that GE presented. But when buyers become aggressive at oversold levels, the DI crossover system can often reap greater rewards. |
| To exit this trade, a swing trader might want to use trailing stops or wait for the stochastic (20,20) line to move below 80 as prices break down, rather than using the double-bottom target of $40.65, whereas trend traders should watch for a bearish crossover on the MACD, or another crossover of the DI lines on the ADX. Then there is the use of the 10- and 20-day EMA in a double-cross method where a sell signal is generated when the 10-day EMA has a bearish cross below the 20-day EMA. The breaking of this obvious accelerated trendline also might be an excellent place to close the position, looking for a new entry point after prices correct a bit. Even if you use the ADX to enter a trade, that doesn't mean you have to use the same indicator to exit the trade. |
Ron Walker is an active trader and technical analyst. He operates an educational website dedicated to the study of Technical Analysis. The website offers free market analysis with daily video presentations and written commentaries. Ron is a video pioneer, being one of the first to utilize the internet producing Technical Analysis videos. His website is thechartpatterntrader.com
| Website: | thechartpatterntrader.com |
| E-mail address: | thechartpatterntrader@gmail.com |
Click here for more information about our publications!
Comments
Date: 04/07/08Rank: 5Comment:
Date: 04/08/08Rank: 5Comment:
Date: 04/09/08Rank: 5Comment:

Request Information From Our Sponsors
- StockCharts.com, Inc.
- Candle Patterns
- Candlestick Charting Explained
- Intermarket Technical Analysis
- John Murphy on Chart Analysis
- John Murphy's Chart Pattern Recognition
- John Murphy's Market Message
- MurphyExplainsMarketAnalysis-Intermarket Analysis
- MurphyExplainsMarketAnalysis-Visual Analysis
- StockCharts.com
- Technical Analysis of the Financial Markets
- The Visual Investor
- VectorVest, Inc.
- Executive Premier Workshop
- One-Day Options Course
- OptionsPro
- Retirement Income Workshop
- Sure-Fire Trading Systems (VectorVest, Inc.)
- Trading as a Business Workshop
- VectorVest 7 EOD
- VectorVest 7 RealTime/IntraDay
- VectorVest AutoTester
- VectorVest Educational Services
- VectorVest OnLine
- VectorVest Options Analyzer
- VectorVest ProGraphics v6.0
- VectorVest ProTrader 7
- VectorVest RealTime Derby Tool
- VectorVest Simulator
- VectorVest Variator
- VectorVest Watchdog
