HOT TOPICS LIST
- MACD
- Fibonacci
- RSI
- Gann
- ADXR
- Stochastics
- Volume
- Triangles
- Futures
- Cycles
- Volatility
- ZIGZAG
- MESA
- Retracement
- Aroon
INDICATORS LIST
LIST OF TOPICS
PRINT THIS ARTICLE
by Alan R. Northam
QQQQ is now on its last leg upward of its ABC zigzag bear market corrective rally. Once the market correction has completed, look for the next lower price target for QQQQ to be around 24.77.
Position: N/A
Alan R. Northam
Alan Northam lives in the Dallas, Texas area and as an electronic engineer gave him an analytical mind from which he has developed a thorough knowledge of stock market technical analysis. His abilities to analyze the future direction of the stock market has allowed him to successfully trade of his own portfolio over the last 30 years. Mr. Northam is now retired and trading the stock market full time. You can reach him at inquiry@tradersclassroom.com or by visiting his website at http://www.tradersclassroom.com. You can also follow him on Twitter @TradersClassrm.
PRINT THIS ARTICLE
ELLIOTT WAVE
QQQQ On Last Leg Up
04/17/08 10:59:16 AMby Alan R. Northam
QQQQ is now on its last leg upward of its ABC zigzag bear market corrective rally. Once the market correction has completed, look for the next lower price target for QQQQ to be around 24.77.
Position: N/A
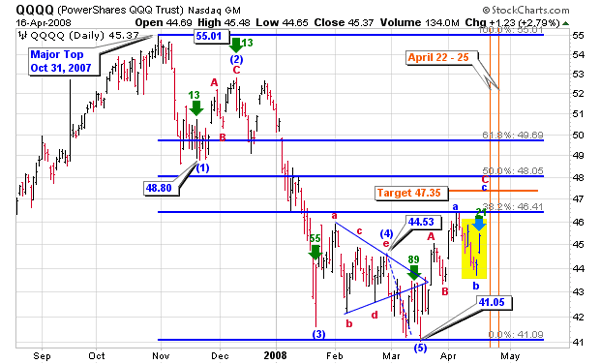
| In Figure 1, I have updated the price chart of QQQQ from that of my previous QQQQ article, dated April 4, 2008. The price bars highlighted by the yellow rectangle box is the price action that has taken place since that article. In my previous article, I mentioned that wave C of the ABC zigzag corrective wave structure was most likely in progress and that wave C could develop into an a-b-c zigzag wave structure itself. That apparently is what is unfolding. I urge you to read my last article, "QQQQ Update," for the details of that discussion. To date, wave a of wave C and wave b of wave C are now complete with wave c of C now in progress. Once wave C is complete, then the next leg down for QQQQ will start. If wave C is complete at the target price of 47.35, then the target price for the next wave down should be around 24.77. However, if wave C ends at a different price than our price target of 47.35, the price target for the next wave down could be different. |

|
| FIGURE 1: QQQQ, DAILY. The price chart shows an Elliott wave count and Fibonacci retracement levels. |
| Graphic provided by: StockCharts.com. |
| |
| Last time, I also mentioned that I thought wave C would end on April 16, which did not happen. I have now modified the date target to be somewhere between April 22 and April 25. In addition, in my previous article, I defined a price target from 46.41 to 48.05. |
| Overall, we still look in pretty good shape for the end of the correction to occur within the next five to eight trading days and should hit a price target from 46.41 to 48.05 before turning back down and heading to new lower low prices. |
Alan Northam lives in the Dallas, Texas area and as an electronic engineer gave him an analytical mind from which he has developed a thorough knowledge of stock market technical analysis. His abilities to analyze the future direction of the stock market has allowed him to successfully trade of his own portfolio over the last 30 years. Mr. Northam is now retired and trading the stock market full time. You can reach him at inquiry@tradersclassroom.com or by visiting his website at http://www.tradersclassroom.com. You can also follow him on Twitter @TradersClassrm.
| Garland, Tx | |
| Website: | www.tradersclassroom.com |
| E-mail address: | inquiry@tradersclassroom.com |
Click here for more information about our publications!
Comments
Date: 04/04/08Rank: 2Comment:
Date: 04/08/08Rank: 5Comment: Good analysis,allthough my analysis points to wave 4 of A of a larger ABC,in progress.

|

Request Information From Our Sponsors
- StockCharts.com, Inc.
- Candle Patterns
- Candlestick Charting Explained
- Intermarket Technical Analysis
- John Murphy on Chart Analysis
- John Murphy's Chart Pattern Recognition
- John Murphy's Market Message
- MurphyExplainsMarketAnalysis-Intermarket Analysis
- MurphyExplainsMarketAnalysis-Visual Analysis
- StockCharts.com
- Technical Analysis of the Financial Markets
- The Visual Investor
- VectorVest, Inc.
- Executive Premier Workshop
- One-Day Options Course
- OptionsPro
- Retirement Income Workshop
- Sure-Fire Trading Systems (VectorVest, Inc.)
- Trading as a Business Workshop
- VectorVest 7 EOD
- VectorVest 7 RealTime/IntraDay
- VectorVest AutoTester
- VectorVest Educational Services
- VectorVest OnLine
- VectorVest Options Analyzer
- VectorVest ProGraphics v6.0
- VectorVest ProTrader 7
- VectorVest RealTime Derby Tool
- VectorVest Simulator
- VectorVest Variator
- VectorVest Watchdog
