HOT TOPICS LIST
- MACD
- Fibonacci
- RSI
- Gann
- ADXR
- Stochastics
- Volume
- Triangles
- Futures
- Cycles
- Volatility
- ZIGZAG
- MESA
- Retracement
- Aroon
INDICATORS LIST
LIST OF TOPICS
PRINT THIS ARTICLE
by Chaitali Mohile
Before beginning the bullish rally, Apple Inc. formed a strong bottom. The surge shows positive signals from all indicators in the charts.
Position: Buy
Chaitali Mohile
Active trader in the Indian stock markets since 2003 and a full-time writer. Trading is largely based upon technical analysis.
PRINT THIS ARTICLE
ROUND TOP & BOTTOM
Apple Forms Stronger Base
04/07/08 10:07:16 AMby Chaitali Mohile
Before beginning the bullish rally, Apple Inc. formed a strong bottom. The surge shows positive signals from all indicators in the charts.
Position: Buy
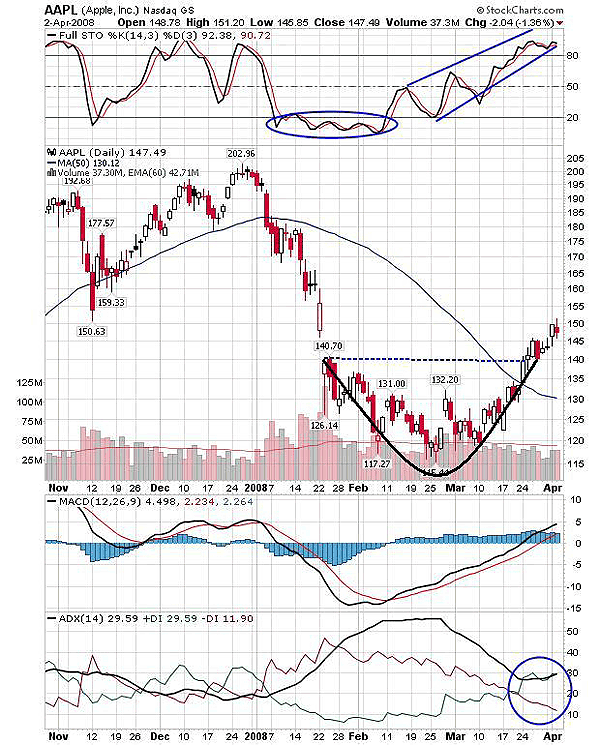
| Apple Inc. hit an all-time high of 202 during its strong uptrend. The stock then plunged, gradually leaving behind some of the support that was formed in past years. The downside journey slowed down as the stock drifted below 140 and the stochastic (14,3,3) reached its oversold area. And instead of moving vertically down, the indicator tangled in the same area, though it was not perfectly flat. This indicated that bears were almost exhausted to carry the decline further. As a result, price began to form a rounded bottom; a bullish reversal pattern and stochastic also rallied above the 20 level. See Figure 1. |

|
| FIGURE 1: AAPL, DAILY. The round-bottom formation has reversed the prior downside rally. The indicator is equally bullish to support the movement. |
| Graphic provided by: StockCharts.com. |
| |
| A "rounded bottom" is a long-term pattern that may occur in three weeks or even in a few years. In the case of AAPL, the pattern was completed in two months and also has fulfilled the breakout condition. The price has moved above a 50-day moving average, confirming the breakout on the pattern. To identify how strong and sustainable the breakout is, we need to refer to the other two indicators too. The moving average convergence/divergence (MACD) (12,26,9) is back in positive territory after a bullish crossover below the zero line. The average directional movement index (ADX) (14) shows a developing uptrend with a declining negative directional index (-DI). And the stochastic (14,3,3) has already moved vertically upward. Even though the indicator is highly overbought it can sustain in the same position for a longer period. |
| So considering AAPL's upward move, it may consolidate, but the bullish force would sustain. |

|
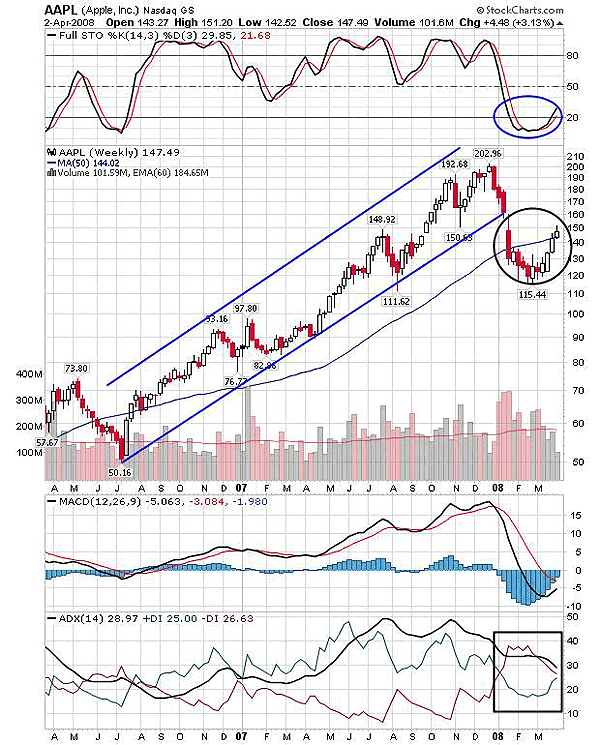
| FIGURE 2: AAPL, WEEKLY. The oversold stochastic has opened a good trading opportunity. The stock has established support on a 50-day MA. |
| Graphic provided by: StockCharts.com. |
| |
| The stochastic (14,3,3) on the weekly chart has a "U" turn offering fresh buying opportunities for long-term traders and investors (Figure 2). The price too has established support on the 50-day moving average and the bullish candles reflect the strength that is necessary to carry the rally ahead. After a lengthy steep fall, the MACD (12,26,9) is trying to recover, suggesting bullish intentions. In addition, the ADX (14) has a declining downtrend and buying pressure is building up. |
| So along with a strong foundation in the form of a rounded bottom, the stock has accumulated bullish strength from the momentum indicators and the uptrend is gearing up as well. The stock has a bullish breakout and gradually can carry the rally back to previous levels. |
Active trader in the Indian stock markets since 2003 and a full-time writer. Trading is largely based upon technical analysis.
| Company: | Independent |
| Address: | C1/3 Parth Indraprasth Towers. Vastrapur |
| Ahmedabad, Guj 380015 | |
| E-mail address: | chaitalimohile@yahoo.co.in |
Traders' Resource Links | |
| Independent has not added any product or service information to TRADERS' RESOURCE. | |
Click here for more information about our publications!
Comments
Date: 04/07/08Rank: 4Comment:

Request Information From Our Sponsors
- VectorVest, Inc.
- Executive Premier Workshop
- One-Day Options Course
- OptionsPro
- Retirement Income Workshop
- Sure-Fire Trading Systems (VectorVest, Inc.)
- Trading as a Business Workshop
- VectorVest 7 EOD
- VectorVest 7 RealTime/IntraDay
- VectorVest AutoTester
- VectorVest Educational Services
- VectorVest OnLine
- VectorVest Options Analyzer
- VectorVest ProGraphics v6.0
- VectorVest ProTrader 7
- VectorVest RealTime Derby Tool
- VectorVest Simulator
- VectorVest Variator
- VectorVest Watchdog
- StockCharts.com, Inc.
- Candle Patterns
- Candlestick Charting Explained
- Intermarket Technical Analysis
- John Murphy on Chart Analysis
- John Murphy's Chart Pattern Recognition
- John Murphy's Market Message
- MurphyExplainsMarketAnalysis-Intermarket Analysis
- MurphyExplainsMarketAnalysis-Visual Analysis
- StockCharts.com
- Technical Analysis of the Financial Markets
- The Visual Investor
