HOT TOPICS LIST
- MACD
- Fibonacci
- RSI
- Gann
- ADXR
- Stochastics
- Volume
- Triangles
- Futures
- Cycles
- Volatility
- ZIGZAG
- MESA
- Retracement
- Aroon
INDICATORS LIST
LIST OF TOPICS
PRINT THIS ARTICLE
by Chaitali Mohile
The huge gap down breakdown from a descending triangle has added a bearish force in Schering Plough. Even an oversold stochastic would be helpless to bring about a consistent upward rally.
Position: N/A
Chaitali Mohile
Active trader in the Indian stock markets since 2003 and a full-time writer. Trading is largely based upon technical analysis.
PRINT THIS ARTICLE
DESCENDING TRIANGLES
Schering Plough Remains Bearish
04/04/08 10:46:12 AMby Chaitali Mohile
The huge gap down breakdown from a descending triangle has added a bearish force in Schering Plough. Even an oversold stochastic would be helpless to bring about a consistent upward rally.
Position: N/A
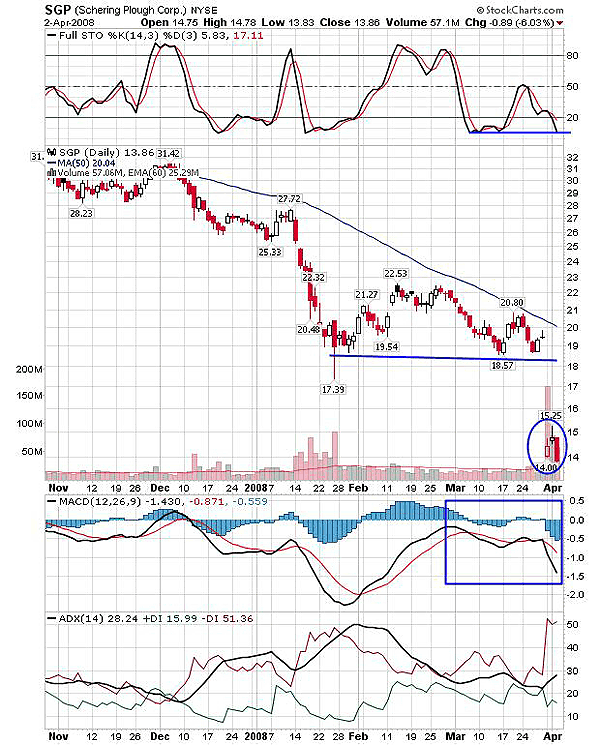
| Schering Plough (SGP) has been in an intermediate downtrend for the past five to six months. The stock slipped from 32 to as low as the 17-18 level where it consolidated in a range, which turned narrower. Price and moving averages go hand in hand, and in Figure 1, the 50-day moving average also has a vertical decline with the price crashing down. The consolidation with the support at the 17-18 level therefore was under pressure of the 50-day moving average and compressed the upward movement of the stock while consolidating, forming a descending triangle on the chart. |

|
| FIGURE 1: SGP, DAILY. This chart shows the bearish mood of Schering Plough. The descending triangle broke off with a huge gap down. |
| Graphic provided by: StockCharts.com. |
| |
| In Figure 1, SGP didn't just break out of the bearish pattern but has a huge gap down, creating a large bearish force in the stock. Volume had dried up when the stock was consolidating, and the breakdown encouraged traders to sell. The moving average convergence/divergence (MACD) (12,26,9) was flirting with its trigger line till the gap down dragged the indicator down. The downtrend is again developing, so the bearish pressure is robust and can easily ignore the oversold stochastic. The stochastic (14,3,3) cannot bring a significant pullback on the back of its oversold position. The upside rally has too many hurdles in its path, so the bearish movement is likely to continue, according to the daily chart. |

|
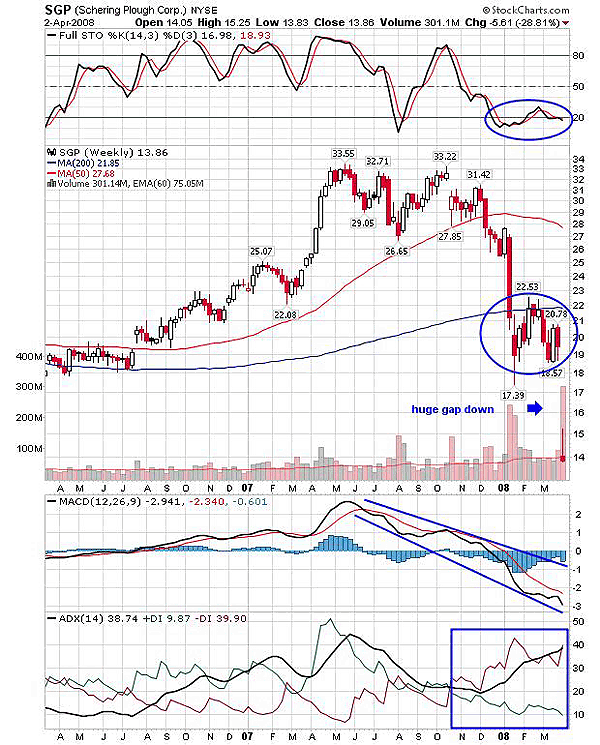
| FIGURE 2: SGP, WEEKLY. The oversold stochastic is the only bullish indicator on this chart, and not strong enough to pull the stock upside. As other two indicators are bearish and price too has much resistance, the fresh bullish rally is a challenge. |
| Graphic provided by: StockCharts.com. |
| |
| On the weekly chart (Figure 2), the stock has been trading below the 200-day moving average since January 2008. The stock has turned all support to resistance with the prolonged correction. Here also the indicators reflect the same bearish image as in Figure 1. The MACD (12,26,9) had a steep fall from positive to negative territory. The average directional movement index (ADX) (14) shows a well-developed downtrend. Along with oversold stochastic (14,3,3) indicators, I would just like to draw the attention of traders toward the support area (marked in a circle) that was violated by a huge gap down. Earlier in 2006, a fresh bullish rally started from the same support area, forming a stronger base for a current period according to the chart. But the support zone was easily left behind by the gap down that occurred recently. The stochastic has been oversold for three months and shows no intention to begin a bullish journey. This can even result again in consolidation at lower levels before moving ahead. Thus, the bearish notes in SGP are likely to continue till some stronger support comes in. |
Active trader in the Indian stock markets since 2003 and a full-time writer. Trading is largely based upon technical analysis.
| Company: | Independent |
| Address: | C1/3 Parth Indraprasth Towers. Vastrapur |
| Ahmedabad, Guj 380015 | |
| E-mail address: | chaitalimohile@yahoo.co.in |
Traders' Resource Links | |
| Independent has not added any product or service information to TRADERS' RESOURCE. | |
Click here for more information about our publications!
Comments
Date: 04/04/08Rank: 3Comment:

|

Request Information From Our Sponsors
- StockCharts.com, Inc.
- Candle Patterns
- Candlestick Charting Explained
- Intermarket Technical Analysis
- John Murphy on Chart Analysis
- John Murphy's Chart Pattern Recognition
- John Murphy's Market Message
- MurphyExplainsMarketAnalysis-Intermarket Analysis
- MurphyExplainsMarketAnalysis-Visual Analysis
- StockCharts.com
- Technical Analysis of the Financial Markets
- The Visual Investor
- VectorVest, Inc.
- Executive Premier Workshop
- One-Day Options Course
- OptionsPro
- Retirement Income Workshop
- Sure-Fire Trading Systems (VectorVest, Inc.)
- Trading as a Business Workshop
- VectorVest 7 EOD
- VectorVest 7 RealTime/IntraDay
- VectorVest AutoTester
- VectorVest Educational Services
- VectorVest OnLine
- VectorVest Options Analyzer
- VectorVest ProGraphics v6.0
- VectorVest ProTrader 7
- VectorVest RealTime Derby Tool
- VectorVest Simulator
- VectorVest Variator
- VectorVest Watchdog
