HOT TOPICS LIST
- MACD
- Fibonacci
- RSI
- Gann
- ADXR
- Stochastics
- Volume
- Triangles
- Futures
- Cycles
- Volatility
- ZIGZAG
- MESA
- Retracement
- Aroon
INDICATORS LIST
LIST OF TOPICS
PRINT THIS ARTICLE
by Chaitali Mohile
GE is offering a good trading opportunity, violating the resistance with a breakout and beginning a new uptrend.
Position: Buy
Chaitali Mohile
Active trader in the Indian stock markets since 2003 and a full-time writer. Trading is largely based upon technical analysis.
PRINT THIS ARTICLE
BREAKOUTS
Is General Electric A Good Buy?
04/03/08 11:25:58 AMby Chaitali Mohile
GE is offering a good trading opportunity, violating the resistance with a breakout and beginning a new uptrend.
Position: Buy
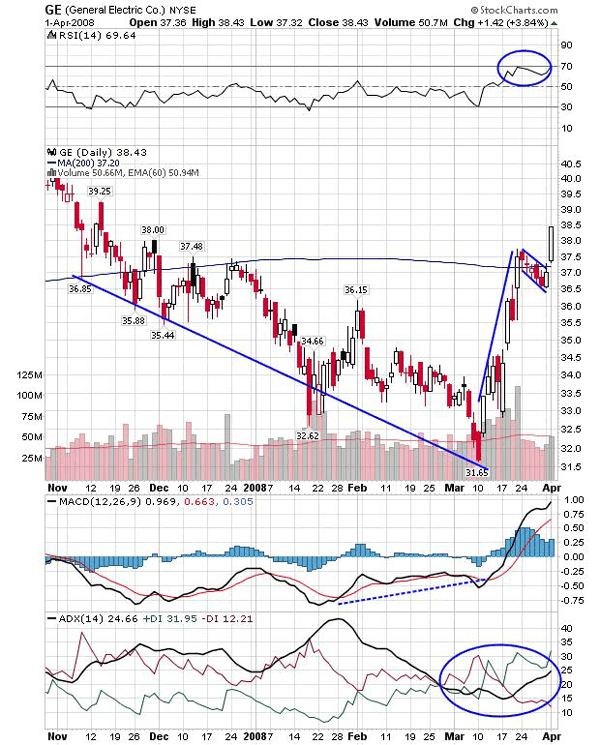
| General Electric has strong goodwill in the consumer market and therefore holds weight in the financial markets too. But the stock has been trading lower in the last few months. By mid-March the stock was trading $10 lower from the highs under the resistance of 200-day moving average. When the price was lowering further, the indicators on the contrary were forming some robust base for the bullish rally. The moving average convergence/divergence (MACD) (12,26,9) (see Figure 1) showed volatile movement in negative territory but was rallying in the direction of the zero line. And the relative strength index (RSI) (14) reached its historical support at 30 levels. As we can see, the oscillator has never moved below 30, so it reflects strong support building at this level. |

|
| FIGURE 1: GE, DAILY. The pullback rally consolidated below the 200-day MA resistance, forming a flag & pennant pattern. The stock has broken out of the pattern and is ready to surge. |
| Graphic provided by: StockCharts.com. |
| |
| In addition, the downtrend has reached its overheated levels, as the average directional movement index (ADX) (14) moved above 40 levels. The indicator therefore declined, reducing the bearish hold on the trend. Thus, as the stock hit its lowest low at 31.65, bulls rushed in, pushing the stock above the lows. Both momentum indicators hurriedly shifted in bullish areas, encouraging the rally, and adding up the volume, which is again an important aspect for a successful pullback. In just a few trading sessions, the stock regained almost 50% of the losses and the rally paused under the 200-day MA resistance. The positive sentiments were already built up so the consolidation seemed healthier and signaled a further breakout. This formed the flag & pennant continuation pattern. |
| The stock has surged out of two major resistances -- the flag & pennant pattern and the 200-day MA. The breakout therefore is stronger and surely a good buying opportunity. The indicators are positive and an uptrend is developing. The minimum level can be easily measured with a flag & pennant breakout formula, but here we will look at our previous high as the first target. To calculate the estimated level, 37.5 - 32.5 = 5 (the length of flag pole) is added to breakout level that is 37, so 37+5 = 42 is the target on the pattern breakout. Due to present volatility, the stock may retrace to its previous support level; but as far as 200-day MA support is established and the indicators remain bullish, the rally remains bullish. |

|
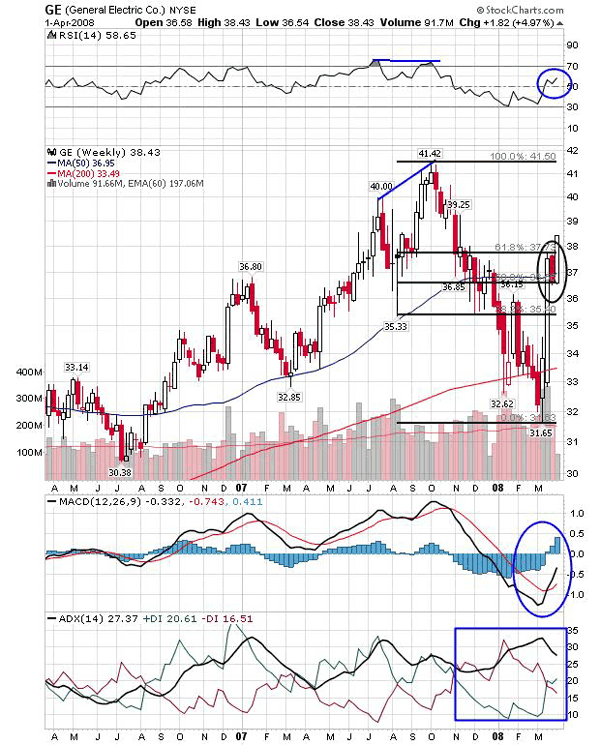
| FIGURE 2: GE, WEEKLY. GE has recovered 61.8% Fibonacci retracement levels and is ready to hit its previous high. The indicators are very well positive to support the rally and even uptrend is developing. |
| Graphic provided by: StockCharts.com. |
| |
| On the weekly chart (Figure 2), while GE was trying to reach its higher levels from 40 to 41, the RSI (14) was reluctant to move to new highs. This signifies poor bullish strength that can carry the stock ahead. This divergence was the first indication of the huge correction on the chart. The stock then slipped, losing approximately $10, moving even below the long-term moving average (200-day MA). This downside rally stabilized and tried to violate the resistance on positive notes from a bullish crossover of MACD (12,26,9) and RSI (14). The pullback thus began, and the Fibonacci levels climbed gradually as the 200-day MA resistance was converted to support. The stock has recovered 61% retracement levels and is now ready to recover fully. The ADX (14) indicates a developing uptrend and RSI (14) allows traders and investors to enter a long position. |
| Trades can go long on this breakout from a flag & pennant with the first target first being the previous high and the next target at $42. |
Active trader in the Indian stock markets since 2003 and a full-time writer. Trading is largely based upon technical analysis.
| Company: | Independent |
| Address: | C1/3 Parth Indraprasth Towers. Vastrapur |
| Ahmedabad, Guj 380015 | |
| E-mail address: | chaitalimohile@yahoo.co.in |
Traders' Resource Links | |
| Independent has not added any product or service information to TRADERS' RESOURCE. | |
Click here for more information about our publications!
Comments
Date: 04/04/08Rank: 3Comment:

Request Information From Our Sponsors
- StockCharts.com, Inc.
- Candle Patterns
- Candlestick Charting Explained
- Intermarket Technical Analysis
- John Murphy on Chart Analysis
- John Murphy's Chart Pattern Recognition
- John Murphy's Market Message
- MurphyExplainsMarketAnalysis-Intermarket Analysis
- MurphyExplainsMarketAnalysis-Visual Analysis
- StockCharts.com
- Technical Analysis of the Financial Markets
- The Visual Investor
- VectorVest, Inc.
- Executive Premier Workshop
- One-Day Options Course
- OptionsPro
- Retirement Income Workshop
- Sure-Fire Trading Systems (VectorVest, Inc.)
- Trading as a Business Workshop
- VectorVest 7 EOD
- VectorVest 7 RealTime/IntraDay
- VectorVest AutoTester
- VectorVest Educational Services
- VectorVest OnLine
- VectorVest Options Analyzer
- VectorVest ProGraphics v6.0
- VectorVest ProTrader 7
- VectorVest RealTime Derby Tool
- VectorVest Simulator
- VectorVest Variator
- VectorVest Watchdog
