HOT TOPICS LIST
- MACD
- Fibonacci
- RSI
- Gann
- ADXR
- Stochastics
- Volume
- Triangles
- Futures
- Cycles
- Volatility
- ZIGZAG
- MESA
- Retracement
- Aroon
INDICATORS LIST
LIST OF TOPICS
PRINT THIS ARTICLE
by Alan R. Northam
Through the use of Elliott wave theory, we can see that the market trend for gold has clearly reversed from one of bullishness to one of bearishness.
Position: N/A
Alan R. Northam
Alan Northam lives in the Dallas, Texas area and as an electronic engineer gave him an analytical mind from which he has developed a thorough knowledge of stock market technical analysis. His abilities to analyze the future direction of the stock market has allowed him to successfully trade of his own portfolio over the last 30 years. Mr. Northam is now retired and trading the stock market full time. You can reach him at inquiry@tradersclassroom.com or by visiting his website at http://www.tradersclassroom.com. You can also follow him on Twitter @TradersClassrm.
PRINT THIS ARTICLE
ELLIOTT WAVE
The Gold Rush Is Over
04/01/08 09:36:11 AMby Alan R. Northam
Through the use of Elliott wave theory, we can see that the market trend for gold has clearly reversed from one of bullishness to one of bearishness.
Position: N/A
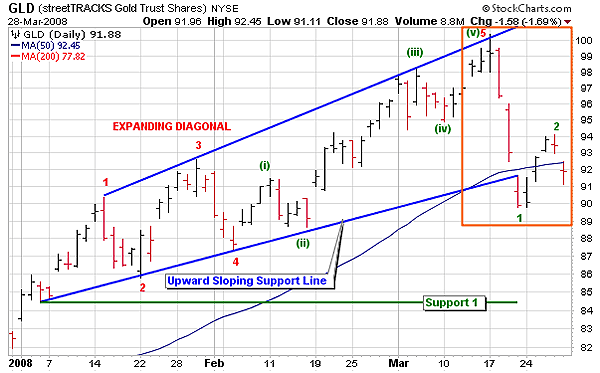
| In my previous article entitled "Gold Rush Playing Out" (Traders.com, 02/29/08), I explained that GLD was forming an expanding diagonal. I further explained that according to Elliott wave theory, expanding diagonals were made up of five overlapping waves. I also explained that during the final stage of wave 5, price usually broke through the upward-sloping resistance line of the expanding diagonal, but it was not a requirement. I also made the statement that at the end of wave 5, buying power would dry up and profit-taking would step in and drive the price of gold down, reversing the trend. As can be seen in Figure 1, gold has reached the upward sloping resistance line of the expanding diagonal, where profit-taking has taken over and driven gold down. In my previous article I also mentioned that the upward-sloping expanding diagonal formation would be complete once price broke through its lower upward-sloping support line. Again, in Figure 1 the price has broken below this lower support line, thus completing the expanding diagonal pattern. |

|
| FIGURE 1: GLD, DAILY. The daily price chart shows a completed expanding diagonal pattern. |
| Graphic provided by: StockCharts.com. |
| |
| Now that GLD has reached the end of wave 5 and the expanding diagonal formation is complete, how do we know that the gold rush is over and that there has been a reversal in trend? Perhaps the recent selloff is simply a market correction and GLD will continue higher once the correction is over. To answer this question, I refer to Elliott wave theory. More than 70 years ago, R.N. Elliott developed a series of rules for analyzing the stock market. Since then, Elliott's rules have been used successfully in market analysis. One of Elliott's rules states that market direction is defined as an impulse wave made up of five nonoverlapping waves. Elliott also defined that after the completion of these five waves, the market corrects in a series of three waves to be followed by the next set of five nonoverlapping waves in the direction of the trend. |
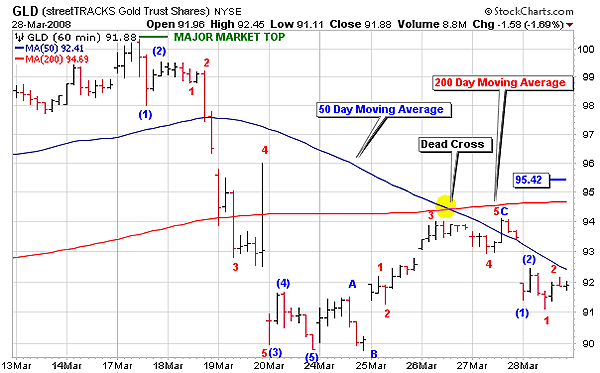
| In Figure 2, I have expanded the area in the gold rectangle from Figure 1. In expanding this area I have broken the daily bars from the rectangle area of Figure 1 down into 60-minute bars so that we can easily see the wave structure. From the market top, GLD has traded downward in five nonoverlapping waves identified in blue as waves (1), (2), (3), (4), and (5). Note also wave (3) has subdivided into five nonoverlapping waves identified in red as waves 1, 2, 3, 4, and 5. This wave structure is referred to as an impulse wave and defines the direction of the market trend in gold, which is now down. |

|
| FIGURE 2: GLD, 60-MINUTE. The 60-minute price chart shows five waves down defining the price trend. |
| Graphic provided by: StockCharts.com. |
| |
| Since the completion of five waves down, GLD has gone through a three-wave correction shown in blue as waves A, B, and C. Having completed wave C, gold has now started a new impulse wave in the downward direction. This impulse wave has completed waves (1) and (2), where wave (2) appears to be subdividing into five waves. Since the current impulse wave has only completed two of its five waves, we can now predict that the future direction for GLD is still down and will continue down until all five waves are complete. |
| Looking at GLD from a more traditional technical analysis point of view, note that on the 60-minute chart that GLD has also formed a "dead cross," indicating that sentiment has changed from bullishness to bearishness. The 50-session (each session being 60 minutes) moving average is acting as resistance as price rallied up to this moving average, bounced off, and is now following it lower. Thus, even from this more traditional method of technical analysis, we can see that GLD is headed lower. In conclusion, looking back at Figure 1, we have seen that wave 1 down is an impulse wave made up of five nonoverlapping waves. We have also learned that according to the Elliott wave principles, an impulse wave defines the direction of the trend, which in the case of GLD is now down. We have also learned that corrective wave 2 is made up of three waves, which are also complete. Further, we have learned that GLD has now completed waves (1) and (2) of the next impulse wave down. Having this knowledge, we can definitely say that "the gold rush is over." |
Alan Northam lives in the Dallas, Texas area and as an electronic engineer gave him an analytical mind from which he has developed a thorough knowledge of stock market technical analysis. His abilities to analyze the future direction of the stock market has allowed him to successfully trade of his own portfolio over the last 30 years. Mr. Northam is now retired and trading the stock market full time. You can reach him at inquiry@tradersclassroom.com or by visiting his website at http://www.tradersclassroom.com. You can also follow him on Twitter @TradersClassrm.
| Garland, Tx | |
| Website: | www.tradersclassroom.com |
| E-mail address: | inquiry@tradersclassroom.com |
Click here for more information about our publications!
PRINT THIS ARTICLE

Request Information From Our Sponsors
- StockCharts.com, Inc.
- Candle Patterns
- Candlestick Charting Explained
- Intermarket Technical Analysis
- John Murphy on Chart Analysis
- John Murphy's Chart Pattern Recognition
- John Murphy's Market Message
- MurphyExplainsMarketAnalysis-Intermarket Analysis
- MurphyExplainsMarketAnalysis-Visual Analysis
- StockCharts.com
- Technical Analysis of the Financial Markets
- The Visual Investor
- VectorVest, Inc.
- Executive Premier Workshop
- One-Day Options Course
- OptionsPro
- Retirement Income Workshop
- Sure-Fire Trading Systems (VectorVest, Inc.)
- Trading as a Business Workshop
- VectorVest 7 EOD
- VectorVest 7 RealTime/IntraDay
- VectorVest AutoTester
- VectorVest Educational Services
- VectorVest OnLine
- VectorVest Options Analyzer
- VectorVest ProGraphics v6.0
- VectorVest ProTrader 7
- VectorVest RealTime Derby Tool
- VectorVest Simulator
- VectorVest Variator
- VectorVest Watchdog
