HOT TOPICS LIST
- MACD
- Fibonacci
- RSI
- Gann
- ADXR
- Stochastics
- Volume
- Triangles
- Futures
- Cycles
- Volatility
- ZIGZAG
- MESA
- Retracement
- Aroon
INDICATORS LIST
LIST OF TOPICS
PRINT THIS ARTICLE
by Alan R. Northam
Apple has rallied into a price area laden with multiple lines of resistance forming strong resistance that will most likely turn this market back down.
Position: N/A
Alan R. Northam
Alan Northam lives in the Dallas, Texas area and as an electronic engineer gave him an analytical mind from which he has developed a thorough knowledge of stock market technical analysis. His abilities to analyze the future direction of the stock market has allowed him to successfully trade of his own portfolio over the last 30 years. Mr. Northam is now retired and trading the stock market full time. You can reach him at inquiry@tradersclassroom.com or by visiting his website at http://www.tradersclassroom.com. You can also follow him on Twitter @TradersClassrm.
PRINT THIS ARTICLE
ELLIOTT WAVE
Apple Up Against Strong Resistance
03/31/08 12:27:22 PMby Alan R. Northam
Apple has rallied into a price area laden with multiple lines of resistance forming strong resistance that will most likely turn this market back down.
Position: N/A
| Apple started its long-term upward trend in early 2003 and completed it at the end of 2007. According to the Elliott wave rules, an upward trend is made up of five waves: wave 1, wave 2 (a corrective wave), wave 3, wave 4 (a second corrective wave), and wave 5 (the final wave). Upon completion of these five waves up, the market then corrects in three waves: wave A down, wave B up that corrects wave A down, and wave C, a final wave down. Further according to Elliott wave theory, upon completion of the ABC corrective waves, the market will have corrected down to the area of the previous fourth wave. |
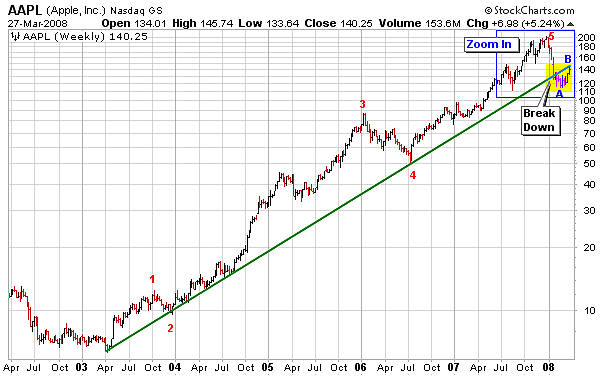
| Figure 1 shows a weekly price chart for Apple (AAPL). Upon inspection, I counted five waves up according to the Elliott wave rules. I have also drawn an upward sloping trendline. Note that in early 2008 the price broke down below this trendline, giving us our first clue that the long-term rally for AAPL had come to an end and confirmed the completion of the five waves up. Having completed five waves up, AAPL is now ready to correct wave 5 up. Looking at the chart, I have shown that it is possible that wave A down is complete. I have also shown that wave B may also be complete. The reason I believe that wave B is now complete is because it has bumped up against the resistance of the underside of the long-term trendline. One of the rules of technical analysis is that once a support line is broken, it becomes new resistance. With AAPL having broken down below the support of the upward sloping trendline, that trendline has now become new resistance and AAPL is now testing this new line of resistance. By zooming in closer I also see other lines of resistance that AAPL is up against. |

|
| FIGURE 1: AAPL, WEEKLY. The AAPL price chart showed a major upward sloping trendline and an Elliott wave count. |
| Graphic provided by: StockCharts.com. |
| |
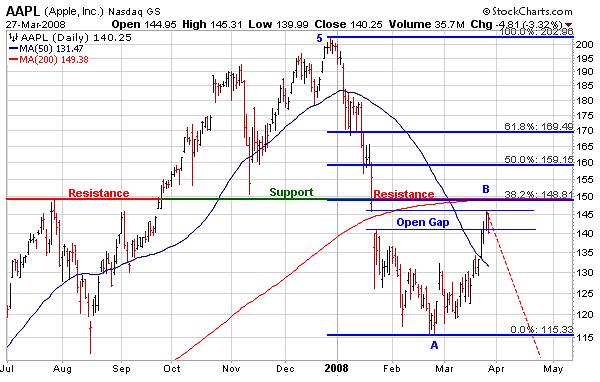
| Figure 2 shows a daily price chart for AAPL. This chart shows that AAPL is now up against multiple lines of resistance. From a technical analysis point of view, whenever price runs up against multiple lines of resistance, that resistance becomes extremely strong and hard to penetrate. Here are the lines of resistance I have identified. First of all, the market has broken down below the line or resistance drawn off the late July 2007 peak in price. Second, AAPL has rallied up to and closed the open gap. Markets very often reverse trends after closing a gap as these gaps act as a line of resistance. Third, AAPL is now trading just below its 200-day moving average. When a market is below the 200-day moving average, the market is defined to be in a long-term bear market. Long-term bear markets normally last from six months to several years. As we can see from the price chart of AAPL, it has not been trading below its 200-day moving average so the long-term bear market for AAPL is still quite young. Thus the 200-day moving average should provide a strong line of resistance for AAPL. And finally I have shown the Fibonacci retracement levels. These are price levels in percentage that markets normally retrace up to. As can be seen from the daily price chart, AAPL is currently trading just below the 38.2% Fibonaaci retracement price level where price normally turns back down. With AAPL now up against multiple lines of resistance, there is a very high probability that wave B is now complete and for AAPL to turn back down. If my analysis is correct, then the final corrective wave, wave C down should now be under way. |

|
| FIGURE 2: AAPL, DAILY. The daily price chart showed multiple resistance lines and Fibonacci retracement levels. |
| Graphic provided by: StockCharts.com. |
| |
| The Elliott wave rules also provide a rule for how far wave C should fall. According to Elliott wave theory, wave C in most cases equals the price movement of wave A. Looking at Figure 2, we see that the beginning of wave A down started at 202.96 and ended at 115.33 for a price movement of 87.63 (202.96 - 115.33). This price movement is then subtracted from the price at the end of wave B or 145.74. Therefore our price target for the end of wave C down becomes 58.11 (145.74 - 87.63). Referring back to Figure 1, we see that 58.11 is in the price area of the previous fourth wave, satisfying one of Elliott's rules that the ABC corrective wave structure normally ends in the area of the previous fourth wave. |
Alan Northam lives in the Dallas, Texas area and as an electronic engineer gave him an analytical mind from which he has developed a thorough knowledge of stock market technical analysis. His abilities to analyze the future direction of the stock market has allowed him to successfully trade of his own portfolio over the last 30 years. Mr. Northam is now retired and trading the stock market full time. You can reach him at inquiry@tradersclassroom.com or by visiting his website at http://www.tradersclassroom.com. You can also follow him on Twitter @TradersClassrm.
| Garland, Tx | |
| Website: | www.tradersclassroom.com |
| E-mail address: | inquiry@tradersclassroom.com |
Click here for more information about our publications!
Comments
Date: 04/01/08Rank: 3Comment:

Request Information From Our Sponsors
- VectorVest, Inc.
- Executive Premier Workshop
- One-Day Options Course
- OptionsPro
- Retirement Income Workshop
- Sure-Fire Trading Systems (VectorVest, Inc.)
- Trading as a Business Workshop
- VectorVest 7 EOD
- VectorVest 7 RealTime/IntraDay
- VectorVest AutoTester
- VectorVest Educational Services
- VectorVest OnLine
- VectorVest Options Analyzer
- VectorVest ProGraphics v6.0
- VectorVest ProTrader 7
- VectorVest RealTime Derby Tool
- VectorVest Simulator
- VectorVest Variator
- VectorVest Watchdog
- StockCharts.com, Inc.
- Candle Patterns
- Candlestick Charting Explained
- Intermarket Technical Analysis
- John Murphy on Chart Analysis
- John Murphy's Chart Pattern Recognition
- John Murphy's Market Message
- MurphyExplainsMarketAnalysis-Intermarket Analysis
- MurphyExplainsMarketAnalysis-Visual Analysis
- StockCharts.com
- Technical Analysis of the Financial Markets
- The Visual Investor
