HOT TOPICS LIST
- MACD
- Fibonacci
- RSI
- Gann
- ADXR
- Stochastics
- Volume
- Triangles
- Futures
- Cycles
- Volatility
- ZIGZAG
- MESA
- Retracement
- Aroon
INDICATORS LIST
LIST OF TOPICS
PRINT THIS ARTICLE
by Chaitali Mohile
EWI has been trading in a wide range and is oversold as well after a prolonged fall. The bottom formation could be a sign of an upcoming rally.
Position: N/A
Chaitali Mohile
Active trader in the Indian stock markets since 2003 and a full-time writer. Trading is largely based upon technical analysis.
PRINT THIS ARTICLE
TECHNICAL ANALYSIS
Are Italy iShares Forming A Bottom?
04/02/08 09:23:29 AMby Chaitali Mohile
EWI has been trading in a wide range and is oversold as well after a prolonged fall. The bottom formation could be a sign of an upcoming rally.
Position: N/A
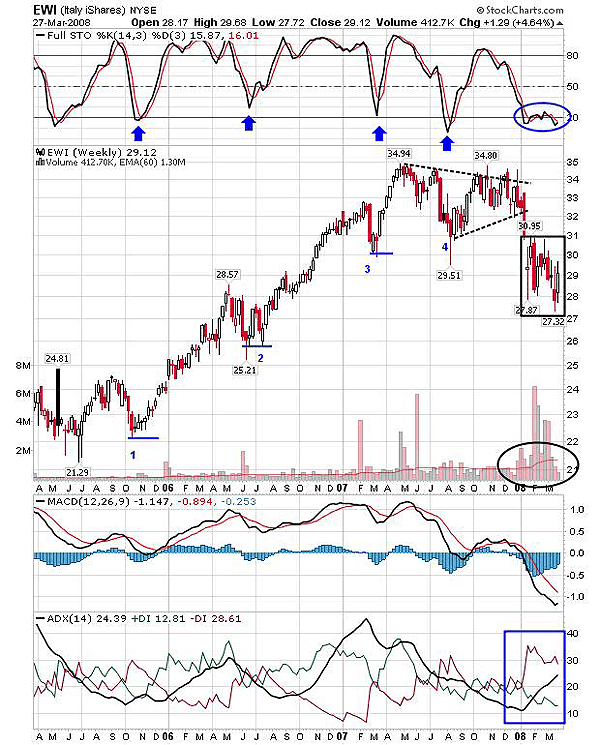
| Consolidation, correction, and recovery are all major aspects of every stock in the financial markets. Like consolidation, correction is equally important in a bullish market, and the type of recovery the stock/index undergoes also emphasizes the mood. EWI has corrected almost every year to some extent, showing a V-shaped recovery most of the time. And for some corrective phase, the recovery was comparatively slower. The stochastic (14,3,3) also shows the vertical surge from an oversold area or from the support level of 20, heading toward the overbought area. The security sustained very well in the overbought area, thrusting the stock higher and higher. |

|
| FIGURE 1: EWI, WEEKLY. The break-through of the symmetrical triangle made the stock move in a wide range. The stochastic is oversold but the MACD (12,26,9) and ADX (14) are highly bearish, so the range-bound move is likely to continue and the bottom may be formed. |
| Graphic provided by: StockCharts.com. |
| |
| As EWI reached higher at 34, correction followed but this time the recovery was volatile prolonging the fall. The stochastic too formed lower highs along with the price and recovered again with the support of 20. This movement formed a symmetrical triangle, creating additional complication, considering the breakout direction. Volume also turned down due to high volatility and the formation of a triangle. There was equal pressure from both demand and supply, resulting in weak trend growth. Eventually, the stock had a downward breakout, killing the drive of buyers, and the trend was eventually won by bears. The stock, for the first time, moved below a 50-day moving average, which weakens the strength and prevailing buyers' confidence. |
| On the breakdown in January 2008, EWI moved in a five-point range with increasing volatility. By the time this breakout happened, financial markets across the world were turning bearish as well. High volatility is indicated by the long upper and lower shadows of the candle (see the marked square in Figure 1). The range was very well traded with low participation due to strong bearish sentiment. The stochastic (14,3,3) reached its oversold position with the breakdown and continued to run flat in the same area. This indicated that EWI is not intending to move lower, so the consolidation can follow. The average directional movement index (ADX) (14) shows developing downtrend. The moving average convergence/divergence (MACD) (12,26,9) continues to be in negative territory. |
| The MACD (12,26,9) and ADX (14) are still bearish but stochastic is oversold. As a result, EWI may surge within the range, but no significant breakout is seen. The bottom might be formed if this range-bound action continues. This will further produce positive sentiment for an upward journey. |
Active trader in the Indian stock markets since 2003 and a full-time writer. Trading is largely based upon technical analysis.
| Company: | Independent |
| Address: | C1/3 Parth Indraprasth Towers. Vastrapur |
| Ahmedabad, Guj 380015 | |
| E-mail address: | chaitalimohile@yahoo.co.in |
Traders' Resource Links | |
| Independent has not added any product or service information to TRADERS' RESOURCE. | |
Click here for more information about our publications!
Comments
Date: 04/02/08Rank: 3Comment:

Request Information From Our Sponsors
- VectorVest, Inc.
- Executive Premier Workshop
- One-Day Options Course
- OptionsPro
- Retirement Income Workshop
- Sure-Fire Trading Systems (VectorVest, Inc.)
- Trading as a Business Workshop
- VectorVest 7 EOD
- VectorVest 7 RealTime/IntraDay
- VectorVest AutoTester
- VectorVest Educational Services
- VectorVest OnLine
- VectorVest Options Analyzer
- VectorVest ProGraphics v6.0
- VectorVest ProTrader 7
- VectorVest RealTime Derby Tool
- VectorVest Simulator
- VectorVest Variator
- VectorVest Watchdog
- StockCharts.com, Inc.
- Candle Patterns
- Candlestick Charting Explained
- Intermarket Technical Analysis
- John Murphy on Chart Analysis
- John Murphy's Chart Pattern Recognition
- John Murphy's Market Message
- MurphyExplainsMarketAnalysis-Intermarket Analysis
- MurphyExplainsMarketAnalysis-Visual Analysis
- StockCharts.com
- Technical Analysis of the Financial Markets
- The Visual Investor
