HOT TOPICS LIST
- MACD
- Fibonacci
- RSI
- Gann
- ADXR
- Stochastics
- Volume
- Triangles
- Futures
- Cycles
- Volatility
- ZIGZAG
- MESA
- Retracement
- Aroon
INDICATORS LIST
LIST OF TOPICS
PRINT THIS ARTICLE
by Ron Walker
The bears continue to have a hard time writing the obituary for the bull market that began in 2003. Will it die? Not yet -- the weekly charts show that the market is on life support.
Position: N/A
Ron Walker
Ron Walker is an active trader and technical analyst. He operates an educational website dedicated to the study of Technical Analysis. The website offers free market analysis with daily video presentations and written commentaries. Ron is a video pioneer, being one of the first to utilize the internet producing Technical Analysis videos. His website is thechartpatterntrader.com
PRINT THIS ARTICLE
CHART ANALYSIS
Putting Paid To The Bull Market?
03/31/08 12:15:05 PMby Ron Walker
The bears continue to have a hard time writing the obituary for the bull market that began in 2003. Will it die? Not yet -- the weekly charts show that the market is on life support.
Position: N/A
| This market has acted like the Energizer Bunny that you see in commercials, because it just won't die. So let's evaluate the market through the vantage point of the Standard and Poor's 500. The S&P 500 is a good gauge to properly assess the stock market. The S&P 500 accounts for approximately 75% of the total stock market value in the US. So it is essential in assessing whether the stock market is shifting gears and moving into a bear market. It is true, there's no agreed-upon definition of a bear market, but a generally accepted description is a price decline of 20% or more over at least a two-month span of time. Therefore, the stock market would be in "accepted" bear market territory if prices fell 20% below the S&P 500 closing at an all-time high of 1565 made on October 9, 2007. That means that a bear market would be triggered by a close below 1252 on the S&P 500, which would be represented by a loss of 313 points. The NASDAQ Composite has already fallen below the 20% guideline, but the S&P 500 and the Dow Jones Industrial Average (DJIA) have yet to meet that criteria. But during the recent recovery off the March lows, the NASDAQ has moved out of bear market territory. During the correction so far, the S&P 500 has lost 18.90% at its lowest close on March 17, while the NASDAQ lost over 24.15% at its low made on March 10, dropping 690 points from its October high. Years ago, on the banks of the Niagara River, there was a sign posted just a few hundred yards before the rapids take that final plunge, which read "past redemption point." It gave a forewarning to the danger that was ahead. If the S&P 500 experiences a price decline in excess of 20%, it might go beyond redemption point, moving past the point of no return. |

|
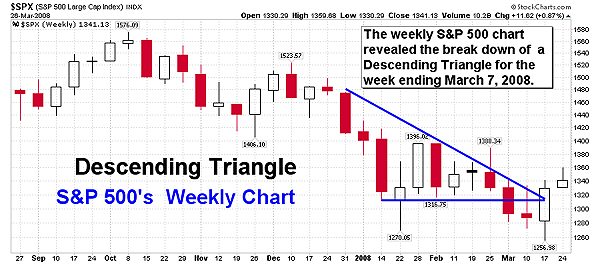
| FIGURE 1: S&P 500, WEEKLY. During the first part of 2008, a bearish descending triangle formed on the S&P 500 weekly chart. Then during the first week of March 2008, the descending triangle broke down as prices closed below the January lows, falling to a close low of 1276. But in late March, prices rebounded above the descending triangle. |
| Graphic provided by: StockCharts.com. |
| |
| During the first week of January 2008, the S&P 500 weekly chart broke its long-term rising trendline from 2003. Over the next three months, a bearish descending triangle formed on its weekly chart (Figure 1). Then during the first week of March 2008, the descending triangle broke down as prices closed below the January lows, falling to a close low of 1276. The following week, a doji candlestick appeared on the weekly chart, which represented indecision on the part of investors. By the third week in March prices made a new weekly low of 1256, but by the end of the week managed to close back above both the upper and lower boundaries of the descending triangle (Figure 1). Once prices ran into support at the 2005 rising trendline, they got a bounce (Figure 2). Now prices appear to be rising to test the intermediate declining trendline from the October high. They will run into it near the 1400 to 1420 area, which is near the last minor peak on the daily chart. The 1396 area is acting resistance on the daily chart (Figure 3). If the weekly S&P 500 chart reflects that prices are moving above that 1396 level, they could test the broken long-term trendline near the 1450 area. The bears are now worried about the bounce that we recently got off the 2005 trendlines on the weekly charts, but they insist that this has all the earmarks of a bear market rally. If prices move above the intermediate declining trendline, the bears will state that prices are backtesting the long-term major trendline. Prices have a tendancey to test a trendline once it has been broken. On the other hand, if the bulls are right and the market is staging a recovery, then the 2005 trendline should remain unviolated maintaining its authority. But in order for that to happen, the market would have had to have already priced in an economic slowdown. Economists tell us that the stock market discounts the future six to eight months in advance, so soft real Gross Domestic Product (GDP) figures could already be factored into the stock market for the first and second quarters of 2008. The first-quarter real GDP figures will be released in April. |

|
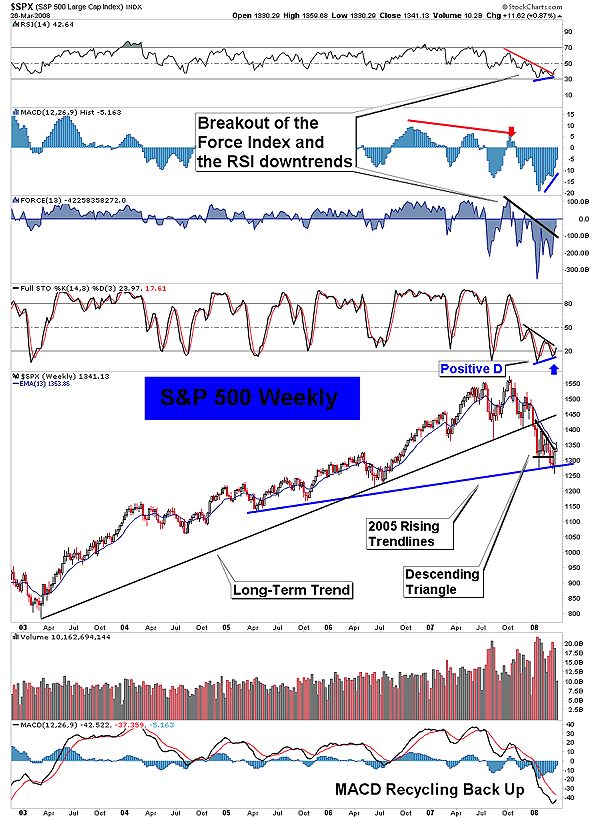
| FIGURE 2: S&P 500, WEEKLY. After breaking down from a descending triangle, the S&P 500 found support off of the 2005 trendline. As the bounce occurred, several indicators turned favorable. Prices could rise to test the long-term trend. |
| Graphic provided by: StockCharts.com. |
| |
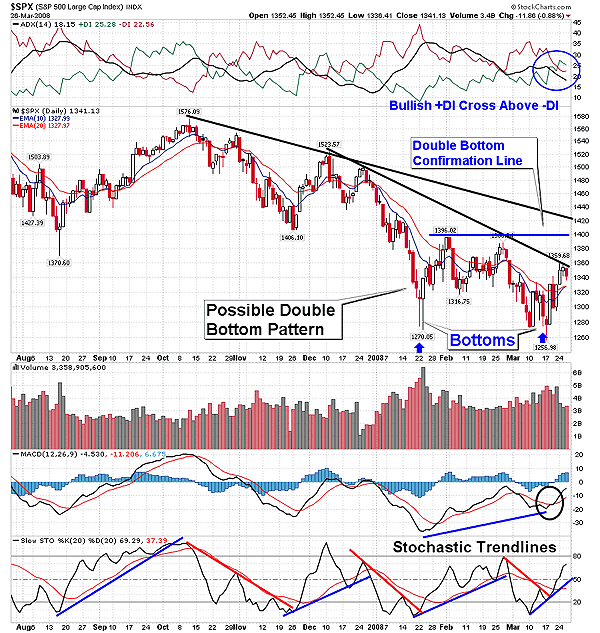
| If the S&P 500 rises above the 1396 area of resistance, a double-bottom pattern will be in play, with the two bottoms being the January and March lows (Figure 3). If the double-bottom pattern successfully moves above the confirmation line of the pattern, at 1396 (which is the highest point between the two bottoms), then pattern could rise 139 points. That would have an objective target of 1535, taking the S&P 500 back to just above the December high. If that occurs, it would move prices above the broken long-term major trendline on the weekly chart, and destroy the bearish argument that prices are backtesting the major trendline. However, prices must break above the intermediate downward trendline in order for any recovery to be successful. The bull and bear camps have two very different outlooks on the market and the economy that are, for all intents and purposes, mutually exclusive. So there you have it! For now, we will just have to wait and see how this drama unfolds. |

|
| FIGURE 3: S&P 500, DAILY. If a double-bottom pattern plays out on the S&P 500 in the daily time frame, the pattern would measure 139 points with a target of 1535. That would break the current downtrend. Several trend-based indicators recently have turned positive, suggesting that a change in trend is under way. |
| Graphic provided by: StockCharts.com. |
| |
| The contingency of a recovery is likely, given the daily bullish scenario on many indicators. But currently on the weekly S&P 500 chart, some bullish signs have emerged that might expedite the process (Figure 2). The full 14-period stochastic has gotten a bullish cross above its signal line, which has allowed positive divergence to set up on that indicator. The relative strength indicator (RSI) and the force index have both broken their downward trendlines. Both of those indicators also have positive divergence. But keep in mind the weekly chart can change until a final print of the week is made at the close of the market on Friday. The moving average convergence-divergence (MACD) is now recycling back up toward the slower signal line and may soon cross above it. The moving average convergence/divergence histogram (MACDH), meanwhile, continues to have a rising slope, producing higher and higher bars. Once the bars move above the zero mark, it will have a forceful impact on the impending trend. There are enough shorts in this market that supply could now become a potential source of demand, allowing the trend to change. I am cautiously optimistic that the US stock market will not enter a bear market, and I don't think there is any real concrete evidence that the US will go into a recession. Right now, the second half of 2008 looks good for the economy, which should be just about the time the rate cuts pump some life back into the economy. During the end of the second quarter, in May, the stimulus package checks will be in the hands of tax recipients, which could bolster the retailers. I'm not saying that the economy won't have a recession or that a bear market won't occur, but I am saying things may not be as bleak as some would have us believe. Let's make sure we reconfigure our trading strategy to trade in the direction of the prevailing long-term trend. And let's not be premature in writing the obituary for the bull market, because the bears are having a tough time putting the final nail in the coffin. (Read Edmund A. Mennis' How The Economy Works, published by New York Institute Of Finance in 1999.) |
Ron Walker is an active trader and technical analyst. He operates an educational website dedicated to the study of Technical Analysis. The website offers free market analysis with daily video presentations and written commentaries. Ron is a video pioneer, being one of the first to utilize the internet producing Technical Analysis videos. His website is thechartpatterntrader.com
| Website: | thechartpatterntrader.com |
| E-mail address: | thechartpatterntrader@gmail.com |
Click here for more information about our publications!
Comments
Date: 04/01/08Rank: 3Comment:

Request Information From Our Sponsors
- VectorVest, Inc.
- Executive Premier Workshop
- One-Day Options Course
- OptionsPro
- Retirement Income Workshop
- Sure-Fire Trading Systems (VectorVest, Inc.)
- Trading as a Business Workshop
- VectorVest 7 EOD
- VectorVest 7 RealTime/IntraDay
- VectorVest AutoTester
- VectorVest Educational Services
- VectorVest OnLine
- VectorVest Options Analyzer
- VectorVest ProGraphics v6.0
- VectorVest ProTrader 7
- VectorVest RealTime Derby Tool
- VectorVest Simulator
- VectorVest Variator
- VectorVest Watchdog
- StockCharts.com, Inc.
- Candle Patterns
- Candlestick Charting Explained
- Intermarket Technical Analysis
- John Murphy on Chart Analysis
- John Murphy's Chart Pattern Recognition
- John Murphy's Market Message
- MurphyExplainsMarketAnalysis-Intermarket Analysis
- MurphyExplainsMarketAnalysis-Visual Analysis
- StockCharts.com
- Technical Analysis of the Financial Markets
- The Visual Investor
