HOT TOPICS LIST
- MACD
- Fibonacci
- RSI
- Gann
- ADXR
- Stochastics
- Volume
- Triangles
- Futures
- Cycles
- Volatility
- ZIGZAG
- MESA
- Retracement
- Aroon
INDICATORS LIST
LIST OF TOPICS
PRINT THIS ARTICLE
by Chaitali Mohile
The potential support and falling wedge strengthens the prospective upside rally. In the current volatile situation, this rally could halt for a while before initiating the up move.
Position: N/A
Chaitali Mohile
Active trader in the Indian stock markets since 2003 and a full-time writer. Trading is largely based upon technical analysis.
PRINT THIS ARTICLE
SUPPORT & RESISTANCE
Lam Research Corp. Establishes Support
04/01/08 01:07:36 PMby Chaitali Mohile
The potential support and falling wedge strengthens the prospective upside rally. In the current volatile situation, this rally could halt for a while before initiating the up move.
Position: N/A
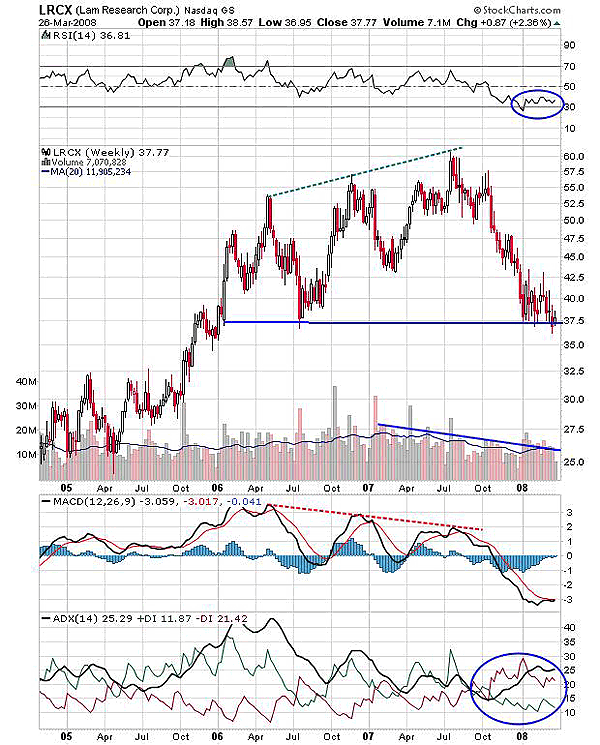
| According to Figure 1, 37.50 has been established as a significant support level as almost two subsequent upside moves began from here and made higher highs. The highest peak at 60 was achieved under unstable conditions given that the volume support remained a cause of concern for this particular stock. For instance, the volume was diminishing and even more volatile when Lam Research Corp. (LRCX) was on its way up to 60. Failure to sustain above this higher level was implied by the negative divergence on the moving average convergence/divergence (MACD) (12,26,9). In addition, the relative strength was not too strong to carry the bullish rally ahead. Thus, the stock tumbled approximately 55% from its high. |

|
| |
| Since the past few months, the stock rested at 37.5, with the level again signifying its importance and raising the hopes for a bullish rally. The relative strength index (RSI) (14) is wandering in the smallest range above 30, so any movement on either side that is above 50 or below 20 would decide the direction of the rally. But on looking at the past history of the potential support level, the rally is more likely to climb upward though it might take a while. Another reason for a slow upward rally is the developing downtrend. The average directional movement index (ADX) (14) has moved with a stronger selling pressure; the negative directional index (-DI) is ruling above +DI. |
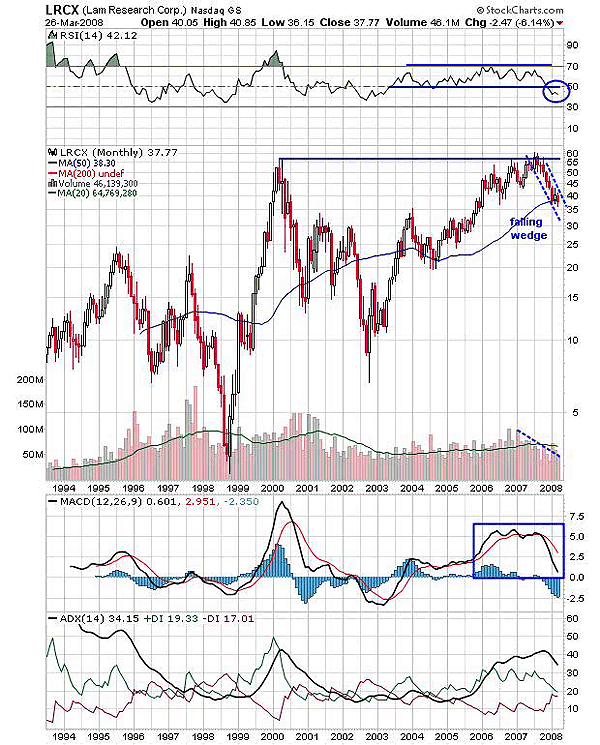
| The soft recovery is under way with the support established at 37.5. The falling wedge on the monthly chart (Figure 2) enhances the possibility that the surge is a bullish reversal pattern. During LRCX's fall in the past few months, the downward moving channel was formed along with reducing volume. |

|
| FIGURE 2: LRCX, MONTHLY. The double-top formation plunged the stock back to moving average support. The downward rally formed a falling wedge with lowering volume. |
| Graphic provided by: StockCharts.com. |
| |
| The slanting move began with a double-top formation (Figure 2). In 2001 the stock was at its all-time high at 60, with an overbought RSI (14). The stock collapsed from these levels, losing more and more; 10 is the lowest level the stock had witnessed and it is still undergoing a recovery. The 60-point gain since 2003 was again in danger due to a double top, with the stock rushing down. The correction has a support below the 50-day moving average, so the fall is likely to end. And the falling wedge that has now formed may give a decent breakout in an upward direction. |
| The RSI (14) has declined marginally below 50, and the MACD (12,26,9) is negative but still in positive territory of the indicator. However, the +DI and -DI are closer and may get tangled, so though the ADX is well developed. Who wins the battle is now very important. On the mixed views on Figure 2, the upward breakout would be highly volatile and may take time to shoot up in full strength. |
Active trader in the Indian stock markets since 2003 and a full-time writer. Trading is largely based upon technical analysis.
| Company: | Independent |
| Address: | C1/3 Parth Indraprasth Towers. Vastrapur |
| Ahmedabad, Guj 380015 | |
| E-mail address: | chaitalimohile@yahoo.co.in |
Traders' Resource Links | |
| Independent has not added any product or service information to TRADERS' RESOURCE. | |
Click here for more information about our publications!
Comments
Date: 04/02/08Rank: 2Comment:

Request Information From Our Sponsors
- StockCharts.com, Inc.
- Candle Patterns
- Candlestick Charting Explained
- Intermarket Technical Analysis
- John Murphy on Chart Analysis
- John Murphy's Chart Pattern Recognition
- John Murphy's Market Message
- MurphyExplainsMarketAnalysis-Intermarket Analysis
- MurphyExplainsMarketAnalysis-Visual Analysis
- StockCharts.com
- Technical Analysis of the Financial Markets
- The Visual Investor
- VectorVest, Inc.
- Executive Premier Workshop
- One-Day Options Course
- OptionsPro
- Retirement Income Workshop
- Sure-Fire Trading Systems (VectorVest, Inc.)
- Trading as a Business Workshop
- VectorVest 7 EOD
- VectorVest 7 RealTime/IntraDay
- VectorVest AutoTester
- VectorVest Educational Services
- VectorVest OnLine
- VectorVest Options Analyzer
- VectorVest ProGraphics v6.0
- VectorVest ProTrader 7
- VectorVest RealTime Derby Tool
- VectorVest Simulator
- VectorVest Variator
- VectorVest Watchdog
