

HOT TOPICS LIST
- MACD
- Fibonacci
- RSI
- Gann
- ADXR
- Stochastics
- Volume
- Triangles
- Futures
- Cycles
- Volatility
- ZIGZAG
- MESA
- Retracement
- Aroon
INDICATORS LIST
LIST OF TOPICS
PRINT THIS ARTICLE
by Scott W. Barrie
March is typically a strong month for corn and soybean futures. However, when counter seasonal weakness occurs it often foreshadows continued weakness into summer.
Position: Sell
Scott W. Barrie
Scott Barrie is President of Commodity Futures and Equity Analytics, LLC. For more informational analysis of the futures markets, visit his websites at www.grainguide.com, and www.commodityseasonals.com He can be reached at barrie@grainguide.com
PRINT THIS ARTICLE
GRAINS
Long Summer for Grain Farmers
04/10/01 08:29:48 AMby Scott W. Barrie
March is typically a strong month for corn and soybean futures. However, when counter seasonal weakness occurs it often foreshadows continued weakness into summer.
Position: Sell
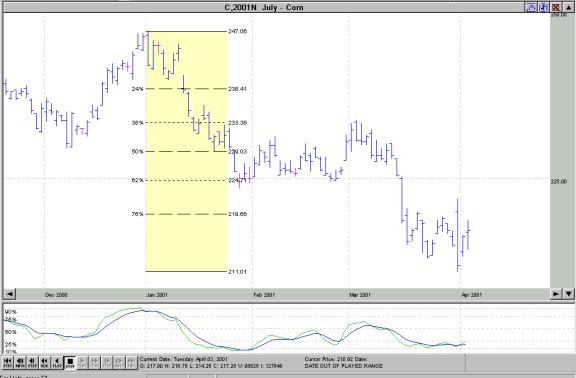
| Historically, the strongest time of the year for the grain markets is the spring. As tractors enter the fields preparing for planting, worries about summer weather and other possible farming mishaps tend to support prices. In March of the preceding 19 years, July corn futures have rallied 15 of the last 19 years, and July soybeans have posted gains 13 times.  This year, things are different. Fear of hoof and mouth disease destroying the demand base (culled livestock consume less grain than healthy, breathing livestock), large grain stocks from last year's bumper crops, and the large South American crops weighed heavily on grain prices in March. July corn futures lost 18 1/2 cents per bushel and July soybeans declined 30 1/4 cents in the wake of these concerns. These declines represent the second worst monthly declines in recent history for corn and soybeans. Since 1982, July corn has only declined four times during the month of March-- 1989: -10 3/4 cents, 1992: -10 cents, 1994: -16 3/4 cents, and 1998: -11 cents. Following each of these declines, July corn posted further losses in April.  Following each of the four monthly declines in March, July corn futures continued lower in April by an average of -10 1/4 cents. In all four cases, the March monthly lows were violated as well, with April seeing declines an average of -15 cents below the March lows. March breaks in the July soybean prices are slightly more common, with six in the previous 19 years-- 1998: -16 3/4, 1994: -3 1/4, 1992: -1 3/4, 1991: -13 3/4, 1989: -33, and 1982: -1/2. Following these six March declines, July soybeans continued lower in four years-- 1998: -8 1/2, 1994: -7, 1992: -16 1/4, and 1989: -18 1/2. In 1991 and 1982, July soybeans rallied in April following a weak March, with gains of +2 1/4 and +18 1/2 cents, respectively. In each of the years in which April saw a decline, July soybean futures posted a lower low, with only 1991 and 1982 seeing higher April monthly lows. Currently, the grain markets are extremely oversold. July corn finished March near the major support established prior to last years harvest (August/September). July soybeans are dramatically lower, at prices not seen since 1972! Based on the severe oversold readings, it may be wise to wait for a retracement rally in corn and soybeans before initiating short positions. The March highs -- 477 1/2 basis July beans and 233 3/4 basis July corn -- should act as solid resistance to the upside and may provide traders with an opportune place for stop losses. |
| With the specter of hoof and mouth disease hanging over the grain markets, and the large amounts of grain stocks, the market may take a wait and see attitude to pricing in any weather events and premiums into this market over the long haul. As such, grain producers may be in for a long summer as history indicates that lower grain prices may be just around the corner. |
|
| Past performance is not necessarily indicative of future results. Chart compliments of www.geckosoftware.com |
| |
Scott Barrie is President of Commodity Futures and Equity Analytics, LLC. For more informational analysis of the futures markets, visit his websites at www.grainguide.com, and www.commodityseasonals.com He can be reached at barrie@grainguide.com
| Company: | Commodity Futures & Equity Analytics, LLC. |
| Address: | 777 NE 7th Street, suite #214 |
| Grants Pass, OR 97526 | |
| Phone # for sales: | 541-472-1975 |
| Website: | www.grainguide.com |
| E-mail address: | barrie@grainguide.com |
Traders' Resource Links | |
| Commodity Futures & Equity Analytics, LLC. has not added any product or service information to TRADERS' RESOURCE. | |
Click here for more information about our publications!
Comments
Date:�04/24/01Rank:�5Comment:�This type of historical research accompanied by such clear charts and graphs is highly useful and appreciated.

Request Information From Our Sponsors
- VectorVest, Inc.
- Executive Premier Workshop
- One-Day Options Course
- OptionsPro
- Retirement Income Workshop
- Sure-Fire Trading Systems (VectorVest, Inc.)
- Trading as a Business Workshop
- VectorVest 7 EOD
- VectorVest 7 RealTime/IntraDay
- VectorVest AutoTester
- VectorVest Educational Services
- VectorVest OnLine
- VectorVest Options Analyzer
- VectorVest ProGraphics v6.0
- VectorVest ProTrader 7
- VectorVest RealTime Derby Tool
- VectorVest Simulator
- VectorVest Variator
- VectorVest Watchdog
- StockCharts.com, Inc.
- Candle Patterns
- Candlestick Charting Explained
- Intermarket Technical Analysis
- John Murphy on Chart Analysis
- John Murphy's Chart Pattern Recognition
- John Murphy's Market Message
- MurphyExplainsMarketAnalysis-Intermarket Analysis
- MurphyExplainsMarketAnalysis-Visual Analysis
- StockCharts.com
- Technical Analysis of the Financial Markets
- The Visual Investor