HOT TOPICS LIST
- MACD
- Fibonacci
- RSI
- Gann
- ADXR
- Stochastics
- Volume
- Triangles
- Futures
- Cycles
- Volatility
- ZIGZAG
- MESA
- Retracement
- Aroon
INDICATORS LIST
LIST OF TOPICS
PRINT THIS ARTICLE
by Chaitali Mohile
After a long time, the Financials Select Sector SPDR is showing signs of recovery. Will it carry the rally ahead?
Position: Buy
Chaitali Mohile
Active trader in the Indian stock markets since 2003 and a full-time writer. Trading is largely based upon technical analysis.
PRINT THIS ARTICLE
CHART ANALYSIS
Does The Financial Sector Have The Strength To Recover?
03/28/08 08:56:03 AMby Chaitali Mohile
After a long time, the Financials Select Sector SPDR is showing signs of recovery. Will it carry the rally ahead?
Position: Buy
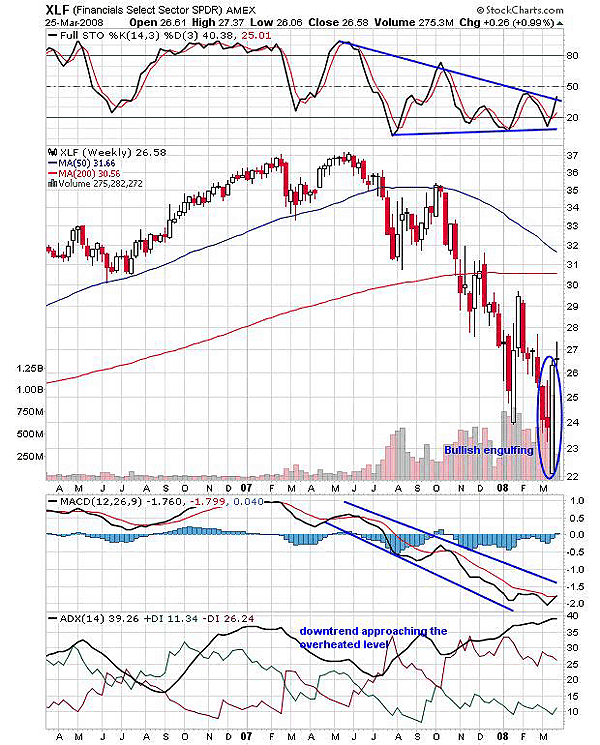
| Since mid-2007, the Financials Select Sector SPDR (XLF) has been hammered and dragged down to lower levels. In addition, every recovery has seen the lower lows, tracing the highs instead. The sector has lost its hold in the last seven to eight months as a result of the current financial crisis. During a recent session, some interesting moves were visible, indicating strength. The sector has gained nearly $4, forming a huge bullish candle that covered two bearish candles. This bullish engulfing pattern shows a stronger reversal pattern, as one single bullish candle has completely engulfed two bearish candles. But the candlestick charting is better followed by more confirmation than isolation. In addition, what worries me is the lack of confidence eventually leading to the lack of participation, possibly weakening the bullish rally. |
| If we decide to keep aside the negative sentiment for the time being, the indicators that have been plotted are showing volatile recovery sessions. The stochastic (14,3,3) is constantly forming lower highs and somewhat stable lows. But probably this time the upper trendline is likely to turn to support, resulting in an upward rally. The rally is not going to be smooth for the sector, as the moving average convergence/divergence (MACD) (12,26,9) is deep in negative territory. Yes, the bullish crossover is visible here in Figure 1, but the indicator has to travel a long way to touch the hearts of bullish buyers and to bring the confidence back. Again, the optimistic view is that the downtrend is close to its overheated levels. |

|
| FIGURE 1: XLF, WEEKLY. The long bullish candle has covered two small bearish candles, and thus suggesting a fresh upside rally. However, the rally need not be too aggressive on bearish notes. |
| Graphic provided by: StockCharts.com. |
| |
| The average directional movement index (ADX) (14) shows overheated trend levels at 40 and above. This sometimes leads to a trend change. In Figure 1, the indicator is not yet declining to indicate the possibility of a trend change, but the existing downtrend may soon get exhausted or slow down. So though the downtrend may not change, some buying opportunities can appear during the relief rally. Traders therefore can trade between support and resistance levels. |

|
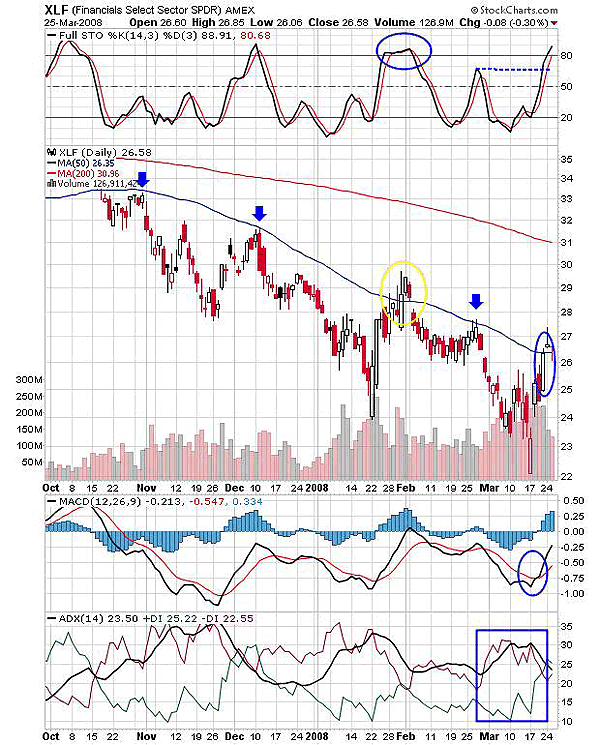
| FIGURE 2: XLF, DAILY. The moving average resistance may get converted to support very soon, and thereon the sector may consolidate on new support. |
| Graphic provided by: StockCharts.com. |
| |
| On the daily chart (Figure 2), the sector's upside swings were suppressed by the 50-day moving average under the strong bearish shadows of the 200-day moving average. The sector has bounced back from this resistance to new lows. XLF once turned down this resistance to support but failed to sustain the support and tumbled even lower. The stock is trying its next attempt to cross the moving average resistance on marginally stronger notes. The stochastic (14,3,3) has moved to an overbought area, and therefore some more room is visible for an upward rally. Earlier, the oscillator could sustain these levels, so we need to be cautious this time. But the trend is still down even though the ADX (14) is declining. The conflict between seller's and buyer's pressures, indicated by -DI and +DI, respectively, can result in consolidation during the relief rally. XLF can consolidate on the freshly formed support of 50-day moving average (MA). The consolidation is more likely to be highly volatile on a bearish background. The MACD (12,26,9) has turned upward in negative territory and could support the relief rally. |
| Thus, XLF may undergo a slow recovery under the resistance of a 200-day moving average. The rally seems to be volatile due to bearish sentiments across the financial markets. |
Active trader in the Indian stock markets since 2003 and a full-time writer. Trading is largely based upon technical analysis.
| Company: | Independent |
| Address: | C1/3 Parth Indraprasth Towers. Vastrapur |
| Ahmedabad, Guj 380015 | |
| E-mail address: | chaitalimohile@yahoo.co.in |
Traders' Resource Links | |
| Independent has not added any product or service information to TRADERS' RESOURCE. | |
Click here for more information about our publications!
Comments
Date: 03/30/08Rank: 3Comment:
Date: 04/01/08Rank: 4Comment:

Request Information From Our Sponsors
- VectorVest, Inc.
- Executive Premier Workshop
- One-Day Options Course
- OptionsPro
- Retirement Income Workshop
- Sure-Fire Trading Systems (VectorVest, Inc.)
- Trading as a Business Workshop
- VectorVest 7 EOD
- VectorVest 7 RealTime/IntraDay
- VectorVest AutoTester
- VectorVest Educational Services
- VectorVest OnLine
- VectorVest Options Analyzer
- VectorVest ProGraphics v6.0
- VectorVest ProTrader 7
- VectorVest RealTime Derby Tool
- VectorVest Simulator
- VectorVest Variator
- VectorVest Watchdog
- StockCharts.com, Inc.
- Candle Patterns
- Candlestick Charting Explained
- Intermarket Technical Analysis
- John Murphy on Chart Analysis
- John Murphy's Chart Pattern Recognition
- John Murphy's Market Message
- MurphyExplainsMarketAnalysis-Intermarket Analysis
- MurphyExplainsMarketAnalysis-Visual Analysis
- StockCharts.com
- Technical Analysis of the Financial Markets
- The Visual Investor
