HOT TOPICS LIST
- MACD
- Fibonacci
- RSI
- Gann
- ADXR
- Stochastics
- Volume
- Triangles
- Futures
- Cycles
- Volatility
- ZIGZAG
- MESA
- Retracement
- Aroon
INDICATORS LIST
LIST OF TOPICS
PRINT THIS ARTICLE
by Ron Walker
The gold trust shares have had an incredible run since mid-August, but is there still future upside potential? The answer lies in its trendline.
Position: N/A
Ron Walker
Ron Walker is an active trader and technical analyst. He operates an educational website dedicated to the study of Technical Analysis. The website offers free market analysis with daily video presentations and written commentaries. Ron is a video pioneer, being one of the first to utilize the internet producing Technical Analysis videos. His website is thechartpatterntrader.com
PRINT THIS ARTICLE
ACCELERATION
Is The Gold Rush Over?
03/25/08 11:20:52 AMby Ron Walker
The gold trust shares have had an incredible run since mid-August, but is there still future upside potential? The answer lies in its trendline.
Position: N/A
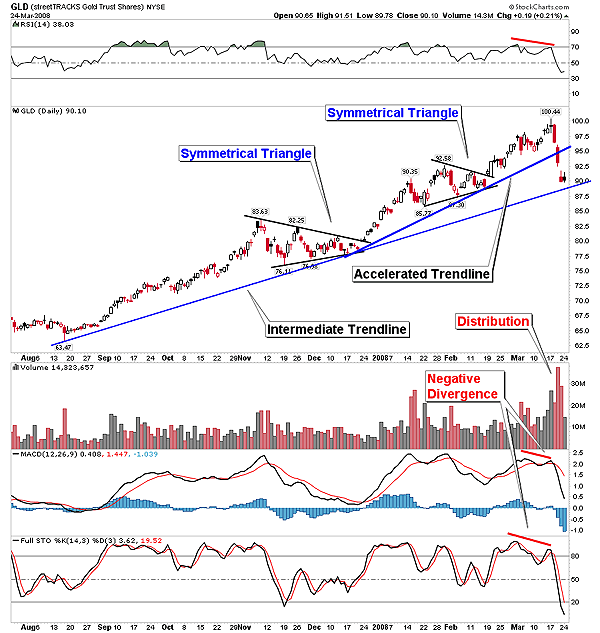
| Interest rate cuts over the past several months have put a lot of pressure on the US dollar. Many savvy investors have turned in their greenbacks for gold, which has provided a hedge against inflation and protection from a falling dollar. But with gold coming off its recent record all-time highs, many investors are wondering about its future prospects. Is investing in the popular gold exchange traded fund (ETF) gold trust shares (GLD) a viable alternative to buying gold? GLD has enjoyed a nice runup since mid-August, but could the advance be over, given the recent volatility? The answer lies in in its trendlines. Upon close examination of GLD's daily chart (Figure 1), it is clear that a visible intermediate uptrend is still present. This intermediate trendline is represented by a straight line of two reference points, one in mid-August and the other in mid-December. During the months of November and December, leading up to the second touch of the intermediate trendline, prices had been consolidating in the form of a symmetrical triangle. The second touch of the intermediate trendline coincided with the apex of the triangle. Once the second touch occurred, GLD found the momentum it needed to propel prices higher, breaking out of the symmetrical triangle. |

|
| FIGURE 1: GLD, DAILY. Early detection of a reversal in GLD was manifested in the form of negative divergence on many indicators, which resulted in the breaking of the accelerated trendline. |
| Graphic provided by: StockCharts.com. |
| |
| This breakout brought about a price surge that changed the velocity at which prices were previously moving. Most trendlines rise at about a 45-degree angle, but during a rising trend, prices can accelerate higher and form what is referred to as an accelerated trendline. An accelerated trendline is a steeper trendline that develops as prices move away from the original intermediate trendline. This often occurs after a period of consolidation has taken place. GLD prices rapidly accelerated away from the intermediate trendline until they ran out of gas just above $92, as seen in Figure 1. At that point, another short consolidation took place that developed another symmetrical triangle continuation pattern. Once the triangle broke out, GLD renewed the advance, marking a second touch of the accelerated trendline. Here again, it is no coincidence that the triangles apex was concurrent with the accelerated trendline. |
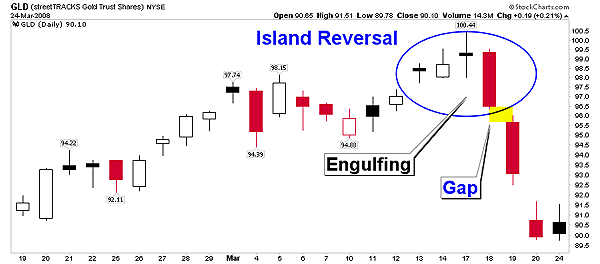
| Then on March 13, prices gapped up and moved higher, trading in a narrow range for the next three sessions, thrusting prices above $100 per share. The advance was now mature and negative divergence was present on several indicators in the daily time frame. Four trading sessions later, on March 18, a bearish engulfing candlestick appeared, pushing prices lower and filled the gap. This one-day reversal pattern was confirmed the following day as prices gapped lower. The gap lower did significant technical damage by carving out an island reversal pattern, confirming the engulfing candlestick and breaking the rising accelerated trendline (Figures 1 and 2). This triple-combination punch dealt a severe knockout blow to GLD, causing a correction phase to begin. Accelerated trendlines are often too steep to be sustainable over a long period of time. In this case, the angle of ascent proved to be unsustainable. But as prices are in a freefall they will run into support at the intermediate rising trendline near $88.50. This may allow prices to successfully touch the intermediate trendline for a third time. But if the trendline is fractured, it will bring about the usual consequences of either price retracement or a corrective consolidation. Penetration of the intermediate trendline would bring about much more severe consequences than the violation of the accelerated trendline did. |

|
| FIGURE 2: GLD, DAILY. The appearance of a bearish engulfing candlestick resulted in an island reversal topping pattern, which ultimately broke the accelerated trendline. |
| Graphic provided by: StockCharts.com. |
| |
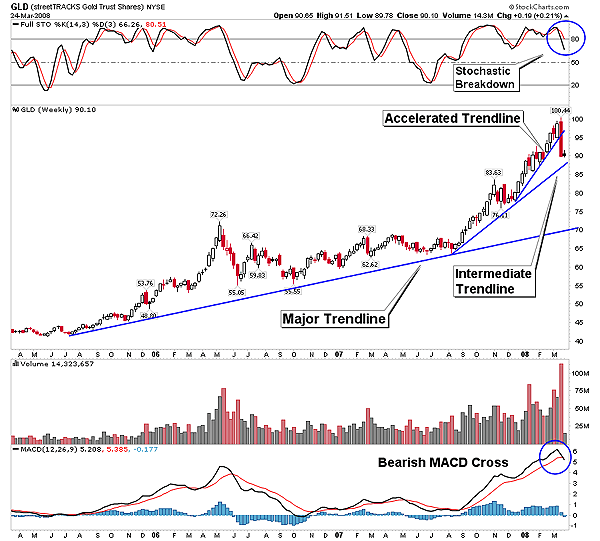
| In Figure 3, we can deduce from the weekly chart that prices are clearly overbought, which could jeopardize the intermediate trendline. Several indicators have now turned negative, which may cause the current correction to test the major trendline near $71. On March 24, the moving average convergence/divergence (MACD) got a bearish cross, while the stochastic line generated a sell signal moving below the value of 80. The near-term future success of the ETF will be based on whether the intermediate trendline remains intact. John Magee and Robert Edwards, in their work Technical Analysis Of Stock Trends, classifies a decisive break of a trendline as a move in excess of 3%. There is an adage that states, "Trendlines are made to be broken," but don't discount the authority of GLD's intermediate trendline, because "a trend is trend until it isn't." |

|
| FIGURE 3: GLD, WEEKLY. The breaking of GLD's accelerated trendline signaled weakness of the weekly chart, with a bearish cross on the MACD and the stochastic line moving below the value of 80. |
| Graphic provided by: StockCharts.com. |
| |
Ron Walker is an active trader and technical analyst. He operates an educational website dedicated to the study of Technical Analysis. The website offers free market analysis with daily video presentations and written commentaries. Ron is a video pioneer, being one of the first to utilize the internet producing Technical Analysis videos. His website is thechartpatterntrader.com
| Website: | thechartpatterntrader.com |
| E-mail address: | thechartpatterntrader@gmail.com |
Click here for more information about our publications!
Comments
Date: 03/27/08Rank: 5Comment:

Request Information From Our Sponsors
- StockCharts.com, Inc.
- Candle Patterns
- Candlestick Charting Explained
- Intermarket Technical Analysis
- John Murphy on Chart Analysis
- John Murphy's Chart Pattern Recognition
- John Murphy's Market Message
- MurphyExplainsMarketAnalysis-Intermarket Analysis
- MurphyExplainsMarketAnalysis-Visual Analysis
- StockCharts.com
- Technical Analysis of the Financial Markets
- The Visual Investor
- VectorVest, Inc.
- Executive Premier Workshop
- One-Day Options Course
- OptionsPro
- Retirement Income Workshop
- Sure-Fire Trading Systems (VectorVest, Inc.)
- Trading as a Business Workshop
- VectorVest 7 EOD
- VectorVest 7 RealTime/IntraDay
- VectorVest AutoTester
- VectorVest Educational Services
- VectorVest OnLine
- VectorVest Options Analyzer
- VectorVest ProGraphics v6.0
- VectorVest ProTrader 7
- VectorVest RealTime Derby Tool
- VectorVest Simulator
- VectorVest Variator
- VectorVest Watchdog
