HOT TOPICS LIST
- MACD
- Fibonacci
- RSI
- Gann
- ADXR
- Stochastics
- Volume
- Triangles
- Futures
- Cycles
- Volatility
- ZIGZAG
- MESA
- Retracement
- Aroon
INDICATORS LIST
LIST OF TOPICS
PRINT THIS ARTICLE
by Koos van der Merwe
Movement in the TSX300 index is heavily influenced by movement in the oil and gold prices. As both fell, so did the TSX -- is the index now a thing of the past?
Position: Buy
Koos van der Merwe
Has been a technical analyst since 1969, and has worked as a futures and options trader with First Financial Futures in Johannesburg, South Africa.
PRINT THIS ARTICLE
ELLIOTT WAVE
The Toronto Index
03/25/08 11:12:04 AMby Koos van der Merwe
Movement in the TSX300 index is heavily influenced by movement in the oil and gold prices. As both fell, so did the TSX -- is the index now a thing of the past?
Position: Buy
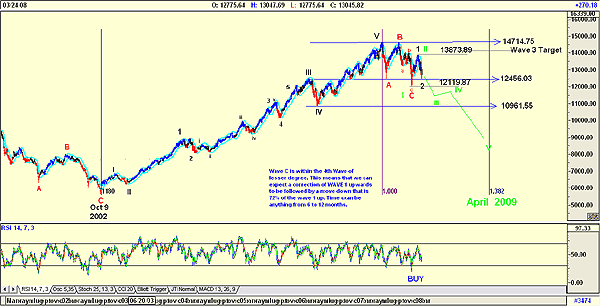
| Figure 1 shows an Elliott wave count starting from October 9, 2002. The count looks good, which is the first rule of Elliott wave analysis. As you can see on the chart, wave C down bottomed within the fourth wave of lesser degree. This suggested the start of a new bull market for the TSX, which then rose in a wave I to 13873.89 from a low of 12119.87. From this high, it then fell in wave II to find support at 12456.03, the high of wave III from the previous wave count. |

|
| FIGURE 1: TSX. Here's a wave count of the TSX300 index. |
| Graphic provided by: AdvancedGET. |
| |
| Wave 1 = From the low 12119.87 to 13873.89 = 1754.02 Wave 2 = From the high 13873.89 to 12456.03 = 1417.86. This is an 80.83% retracement of wave I. I have found that wave IIs are usually a 72% retracement of wave I, with a wave III then being a 1.618% or greater retracement upward. However, since the wave II fall was greater than 72% it does suggest that the wave III rise could be a failure -- by this I mean a rise equal to or less than the rise of wave 1. Should this occur -- and let me be frank, it very much depends on how the recession in the US resolves itself -- then wave 5 will be less than wave III. This is the primary scenario at the moment. A wave 3 target would therefore be 12456.03 + 1754.02 = 14210.05. Finally, remember that a bear market is usually a 38.8% fall of the rise of waves 1 to 5. This does suggest that my ABC count could be optimistic, because of time, and that the present rise to wave 1 and fall to wave 2 could be the completion of wave I down and wave 2 up of wave C (shown in green). One should not forget that major c-waves fall in a five-wave correction. This would put the end of the bear market in April 2009. |
| For the moment, until proven otherwise, I shall remain bullish, but will change my count without hesitation as and when the situation changes. |
Has been a technical analyst since 1969, and has worked as a futures and options trader with First Financial Futures in Johannesburg, South Africa.
| Address: | 3256 West 24th Ave |
| Vancouver, BC | |
| Phone # for sales: | 6042634214 |
| E-mail address: | petroosp@gmail.com |
Click here for more information about our publications!
Comments
Date: 03/27/08Rank: 1Comment:

Request Information From Our Sponsors
- StockCharts.com, Inc.
- Candle Patterns
- Candlestick Charting Explained
- Intermarket Technical Analysis
- John Murphy on Chart Analysis
- John Murphy's Chart Pattern Recognition
- John Murphy's Market Message
- MurphyExplainsMarketAnalysis-Intermarket Analysis
- MurphyExplainsMarketAnalysis-Visual Analysis
- StockCharts.com
- Technical Analysis of the Financial Markets
- The Visual Investor
- VectorVest, Inc.
- Executive Premier Workshop
- One-Day Options Course
- OptionsPro
- Retirement Income Workshop
- Sure-Fire Trading Systems (VectorVest, Inc.)
- Trading as a Business Workshop
- VectorVest 7 EOD
- VectorVest 7 RealTime/IntraDay
- VectorVest AutoTester
- VectorVest Educational Services
- VectorVest OnLine
- VectorVest Options Analyzer
- VectorVest ProGraphics v6.0
- VectorVest ProTrader 7
- VectorVest RealTime Derby Tool
- VectorVest Simulator
- VectorVest Variator
- VectorVest Watchdog
