HOT TOPICS LIST
- MACD
- Fibonacci
- RSI
- Gann
- ADXR
- Stochastics
- Volume
- Triangles
- Futures
- Cycles
- Volatility
- ZIGZAG
- MESA
- Retracement
- Aroon
INDICATORS LIST
LIST OF TOPICS
PRINT THIS ARTICLE
by Arthur Hill
Fossil forged a morning star reversal at support, but follow-through is needed to complete a breakout and target further gains.
Position: Hold
Arthur Hill
Arthur Hill is currently editor of TDTrader.com, a website specializing in trading strategies, sector/industry specific breadth stats and overall technical analysis. He passed the Society of Technical Analysts (STA London) diploma exam with distinction is a Certified Financial Technician (CFTe). Prior to TD Trader, he was the Chief Technical Analyst for Stockcharts.com and the main contributor to the ChartSchool.
PRINT THIS ARTICLE
CANDLESTICK CHARTING
A Morning Star Reversal For Fossil
03/21/08 09:39:44 AMby Arthur Hill
Fossil forged a morning star reversal at support, but follow-through is needed to complete a breakout and target further gains.
Position: Hold
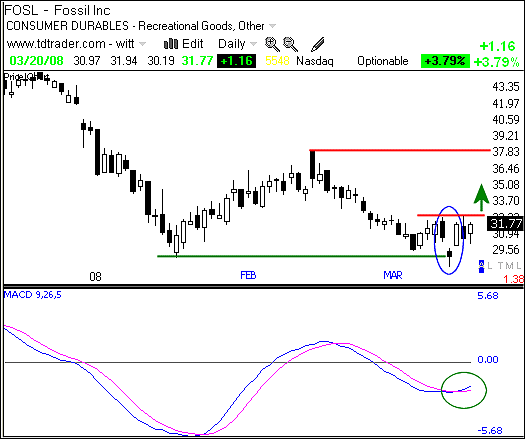
| The morning star formed near the January low and this reinforces support around 29. Actually, the February–March 2008 decline stopped on March 11 and the stock has been consolidating near the January low for the last eight days. The ability to hold around the January low confirms support. |
| It looked as if Fossil (FOSL) would break the January low but recovered to form a morning star pattern and stay above support (blue oval) (Figure 1). This pattern consists of three candlesticks. The first is black and in the direction of the downtrend. The second forms with a gap down, but the stock manages to firm and form a relatively small candlestick. The third candlestick forms with a gap up and strong gap. The two gaps are at the heart of the reversal. |

|
| FIGURE 1: FOSSIL, DAILY. Fossil formed a morning star pattern and stayed above support (blue oval). |
| Graphic provided by: TeleChart2007. |
| |
| Despite this candlestick reversal and upturn in momentum, FOSL remains below consolidation resistance and follow-through is needed for a breakout. The bottom indicator window shows the moving average convergence/divergence (MACD) turning up and breaking above its signal line. This is positive, but resistance is clear and a breakout is needed to validate the morning star pattern pattern. A break above the mid-March highs would target a move to the next resistance zone around 38. |
Arthur Hill is currently editor of TDTrader.com, a website specializing in trading strategies, sector/industry specific breadth stats and overall technical analysis. He passed the Society of Technical Analysts (STA London) diploma exam with distinction is a Certified Financial Technician (CFTe). Prior to TD Trader, he was the Chief Technical Analyst for Stockcharts.com and the main contributor to the ChartSchool.
| Title: | Editor |
| Company: | TDTrader.com |
| Address: | Willem Geetsstraat 17 |
| Mechelen, B2800 | |
| Phone # for sales: | 3215345465 |
| Website: | www.tdtrader.com |
| E-mail address: | arthurh@tdtrader.com |
Traders' Resource Links | |
| TDTrader.com has not added any product or service information to TRADERS' RESOURCE. | |
Click here for more information about our publications!
Comments
Date: 03/22/08Rank: 4Comment:

Request Information From Our Sponsors
- StockCharts.com, Inc.
- Candle Patterns
- Candlestick Charting Explained
- Intermarket Technical Analysis
- John Murphy on Chart Analysis
- John Murphy's Chart Pattern Recognition
- John Murphy's Market Message
- MurphyExplainsMarketAnalysis-Intermarket Analysis
- MurphyExplainsMarketAnalysis-Visual Analysis
- StockCharts.com
- Technical Analysis of the Financial Markets
- The Visual Investor
- VectorVest, Inc.
- Executive Premier Workshop
- One-Day Options Course
- OptionsPro
- Retirement Income Workshop
- Sure-Fire Trading Systems (VectorVest, Inc.)
- Trading as a Business Workshop
- VectorVest 7 EOD
- VectorVest 7 RealTime/IntraDay
- VectorVest AutoTester
- VectorVest Educational Services
- VectorVest OnLine
- VectorVest Options Analyzer
- VectorVest ProGraphics v6.0
- VectorVest ProTrader 7
- VectorVest RealTime Derby Tool
- VectorVest Simulator
- VectorVest Variator
- VectorVest Watchdog
