HOT TOPICS LIST
- MACD
- Fibonacci
- RSI
- Gann
- ADXR
- Stochastics
- Volume
- Triangles
- Futures
- Cycles
- Volatility
- ZIGZAG
- MESA
- Retracement
- Aroon
INDICATORS LIST
LIST OF TOPICS
PRINT THIS ARTICLE
by Alan R. Northam
The financial market looks as if it is ready to turn higher, indicating that the broader stock market could turn higher as well within the next few months, if not sooner.
Position: N/A
Alan R. Northam
Alan Northam lives in the Dallas, Texas area and as an electronic engineer gave him an analytical mind from which he has developed a thorough knowledge of stock market technical analysis. His abilities to analyze the future direction of the stock market has allowed him to successfully trade of his own portfolio over the last 30 years. Mr. Northam is now retired and trading the stock market full time. You can reach him at inquiry@tradersclassroom.com or by visiting his website at http://www.tradersclassroom.com. You can also follow him on Twitter @TradersClassrm.
PRINT THIS ARTICLE
FIBONACCI
Financial Market To Lead Broader Market Up
03/21/08 11:04:32 AMby Alan R. Northam
The financial market looks as if it is ready to turn higher, indicating that the broader stock market could turn higher as well within the next few months, if not sooner.
Position: N/A
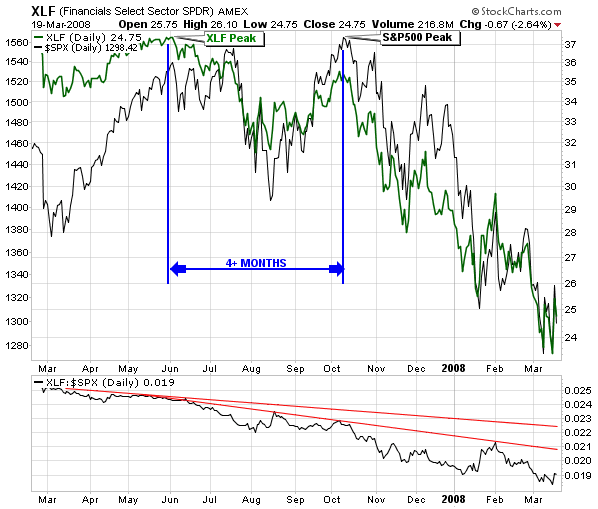
| Financial stocks are known as leaders of the broader stock market and usually form a market top or a market bottom ahead of the broader stock market. Figure 1 illustrates this point. This figure shows a daily stock price chart of financial stocks, represented by an exchange traded fund (ETF) with the stock symbol of XLF, and the Standard & Poor's 500 representing the broader stock market. As you can see, financial stocks made a market top a little more than four months ahead of the S&P 500. |
| Below the price chart is a ratio chart of XLF divided by S&P 500. When the chart slants downward, it is an indication that financial stocks, represented by XLF in the numerator of the ratio, is falling at a faster rate than the S&P 500 in the denominator. This is what we would expect to see if financial stocks were truly leading the broader stock market lower. The question now becomes, "Will financial stocks continue to lead the broader stock market lower in the days, weeks, and months ahead?" To answer this, we must analyze XLF to determine if it still has room to move to the downside. |

|
| FIGURE 1: RATIO OF XLF VS. S&P 500 |
| Graphic provided by: StockCharts.com. |
| |
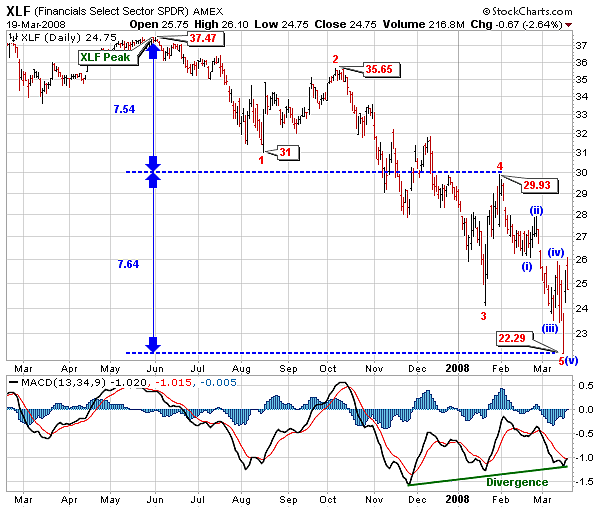
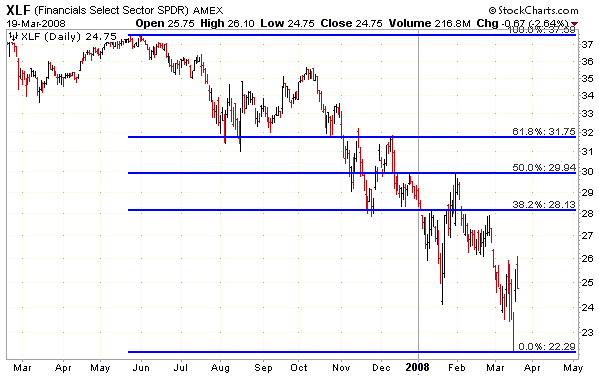
| Figure 2 shows the daily bar chart of XLF. To determine if XLF still has room to move to the downside or if it is ready to turn higher, I have employed the use of Elliott waves and Fibonacci. Note that XLF has formed five waves down. Is wave 5 down complete? If so, XLF could be ready to enter into a correction. Corrections following the first five waves down from a market top are usually deep and could retrace as much as 62% of the distance traveled by the total of the five waves down. I show a chart of possible Fibonacci retracements in Figure 3. |

|
| FIGURE 2: XLF, DAILY. Elliott waves and Fibonacci relationships can be seen here. |
| Graphic provided by: StockCharts.com. |
| |
| Let's look at wave 5 to see if we can determine that it is complete. First I look at the wave structure of wave 5. Here I see that it further divides into five waves, wave (i), (ii), (iii), (iv), and (v) so all five subwaves are present. This is the first piece of evidence that the five waves down from the market top could be complete. Next, I look at the length of wave 5 and compare it to the length of wave 1. Wave 5 starts at a price of $29.93 and ends at $22.29 for a difference of $7.64. Wave 1 starts at $37.47 and ends at $31.00, a difference of $6.47. One of the Fibonacci relationships is that waves 1 and 5 are often equal in length. On our price chart in Figure 2, wave 5 is actually just slightly longer than wave 1. This is further evidence that wave 5 down could be complete. For a third piece of evidence, I looked for other valid Fibonacci relationships and found that the price difference from the market peak to the top of wave 4 equaled $7.54 and that the price difference from the peak of wave 4 to the bottom of wave 5 equaled $7.64. Comparing these two amounts to the complete price range from the market top to the bottom of wave 5, we get 0.50 or 50% (7.54/37.47 - 22.29) and (7.64/37.47 -22.29). The fraction 0.50 is also a valid Fibonacci ratio and lends further evidence that wave 5 down could be complete. |

|
| FIGURE 3: XLF, DAILY. Here's the price chart of XLF showing Fibonacci retracement levels. After the initial five waves down from a market top, the highest probability of a retracement is 61.8%. |
| Graphic provided by: StockCharts.com. |
| |
| As one final piece of evidence that wave 5 could be complete, I have also shown the moving average convergence/divergence (MACD) momentum oscillator in Figure 2. From late November 2007 through mid-March 2008, the MACD has been printing out a bullish divergence. A bullish divergence occurs when the MACD makes higher lows while the price chart makes lower lows. A bullish divergence warns that an important trend change is about to take place. All the evidence points to a high probability that the financial market is about to change direction from down to up. If and when this change in direction takes place, it will most likely do so as a market correction and not the beginning of a new bull market. What this means is that we can expect the financial markets to retrace up to about 62% of the ground it has lost since it peaked in late May of 2007. Once this retracement is complete, then the financial market should turn back down once again and head for a new lower low in price. With the evidence pointing to an upturn in the financial markets, we can expect a bottom in the broader stock market to occur within the next few months, if not sooner. Further, a bottom in the broader stock market does not indicate a change from a bear market to a bull market but that the broader stock market will most likely undergo a significant market correction before turning back down. |
Alan Northam lives in the Dallas, Texas area and as an electronic engineer gave him an analytical mind from which he has developed a thorough knowledge of stock market technical analysis. His abilities to analyze the future direction of the stock market has allowed him to successfully trade of his own portfolio over the last 30 years. Mr. Northam is now retired and trading the stock market full time. You can reach him at inquiry@tradersclassroom.com or by visiting his website at http://www.tradersclassroom.com. You can also follow him on Twitter @TradersClassrm.
| Garland, Tx | |
| Website: | www.tradersclassroom.com |
| E-mail address: | inquiry@tradersclassroom.com |
Click here for more information about our publications!
Comments
Date: 03/25/08Rank: 5Comment:
Date: 03/27/08Rank: 1Comment:

Request Information From Our Sponsors
- StockCharts.com, Inc.
- Candle Patterns
- Candlestick Charting Explained
- Intermarket Technical Analysis
- John Murphy on Chart Analysis
- John Murphy's Chart Pattern Recognition
- John Murphy's Market Message
- MurphyExplainsMarketAnalysis-Intermarket Analysis
- MurphyExplainsMarketAnalysis-Visual Analysis
- StockCharts.com
- Technical Analysis of the Financial Markets
- The Visual Investor
- VectorVest, Inc.
- Executive Premier Workshop
- One-Day Options Course
- OptionsPro
- Retirement Income Workshop
- Sure-Fire Trading Systems (VectorVest, Inc.)
- Trading as a Business Workshop
- VectorVest 7 EOD
- VectorVest 7 RealTime/IntraDay
- VectorVest AutoTester
- VectorVest Educational Services
- VectorVest OnLine
- VectorVest Options Analyzer
- VectorVest ProGraphics v6.0
- VectorVest ProTrader 7
- VectorVest RealTime Derby Tool
- VectorVest Simulator
- VectorVest Variator
- VectorVest Watchdog
