HOT TOPICS LIST
- MACD
- Fibonacci
- RSI
- Gann
- ADXR
- Stochastics
- Volume
- Triangles
- Futures
- Cycles
- Volatility
- ZIGZAG
- MESA
- Retracement
- Aroon
INDICATORS LIST
LIST OF TOPICS
PRINT THIS ARTICLE
by Chaitali Mohile
The bearish engulfing and shooting star may shove down the rally in the stock.
Position: N/A
Chaitali Mohile
Active trader in the Indian stock markets since 2003 and a full-time writer. Trading is largely based upon technical analysis.
PRINT THIS ARTICLE
CANDLESTICK CHARTING
The Rally In AMAT Halts
03/26/08 12:47:23 PMby Chaitali Mohile
The bearish engulfing and shooting star may shove down the rally in the stock.
Position: N/A
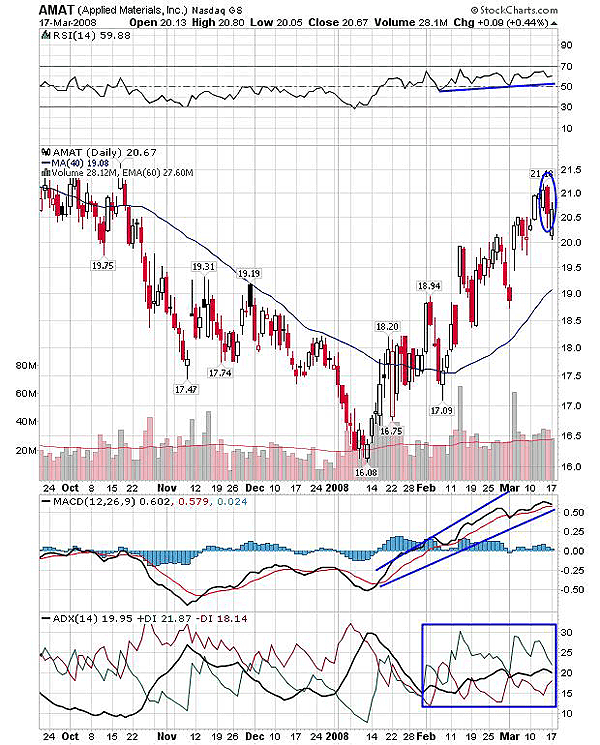
| The one-direction rally in Applied Materials was not smooth enough. Correction at every upper level brought in high volatility in volume, but the strength in the stock was robust enough to carry the advance move ahead. The rally is back to its previous high, which might react as a resistance over the move. Effectively, a bearish engulfing candlestick pattern is being formed at this resistance level. The double-candle pattern is strong enough to terminate the bullish rally. The stock might tumble down a few levels from the recent high. Though this fall would not be too serious, traders can follow the stop-loss to protect their profits. |

|
| FIGURE 1: AMAT, DAILY. The bearish engulfing pattern may bring a pause to a bullish rally. |
| Graphic provided by: StockCharts.com. |
| |
| The bearish engulfing pattern can be seen when the bearish candle completely covers the previous bullish candle that is the real body. The second bearish candle represents the change in the rally and therefore warns the bulls. The moving average convergence/divergence (MACD) (12,26,9) shows the volatile efforts to sustain above the trigger line and shift into positive territory of the indicator. The directional index +DI and -DI are moving towards each other, indicating a rising selling pressure and a declining buying pressure. Whether consolidation will follow is difficult to predict. So currently we are only looking for increasing selling pressure that may lead to some dropping of higher levels. |
| The relative strength index (RSI) (14) is not overbought but sustains in the bullish area. So the upside vertical move may resume later. |

|
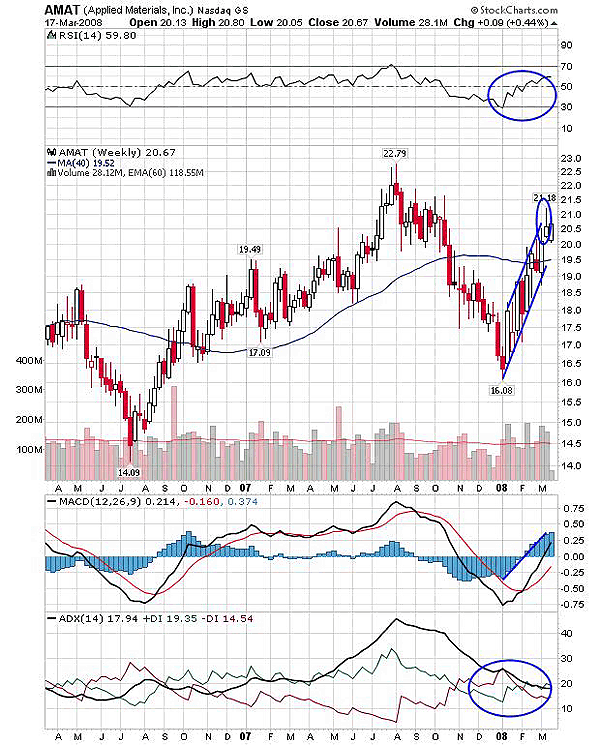
| FIGURE 2: AMAT, WEEKLY. On bullish notes from all the indicators, the upside move may be resumed after a short downfall. |
| Graphic provided by: StockCharts.com. |
| |
| The RSI (14) here shows a sharp vertical recovery in bullish strength with the support established at the 30 levels. The rising wedge with volatile volume has occurred on the chart with a shooting star at the top (Figure 2). Both patterns are bearish and indicate change in direction of the previous move. The RSI (14) and MACD (12,26,9) are still reflecting upward strength, but the ADX (14) does seem to be saying the same thing. |
| I would not recommend quitting the long position, but instead, to follow the stop-loss at 19.5, which is the 40-day MA support, and ride the bull. |
Active trader in the Indian stock markets since 2003 and a full-time writer. Trading is largely based upon technical analysis.
| Company: | Independent |
| Address: | C1/3 Parth Indraprasth Towers. Vastrapur |
| Ahmedabad, Guj 380015 | |
| E-mail address: | chaitalimohile@yahoo.co.in |
Traders' Resource Links | |
| Independent has not added any product or service information to TRADERS' RESOURCE. | |
Click here for more information about our publications!
Comments
Date: 03/30/08Rank: 4Comment:

Request Information From Our Sponsors
- StockCharts.com, Inc.
- Candle Patterns
- Candlestick Charting Explained
- Intermarket Technical Analysis
- John Murphy on Chart Analysis
- John Murphy's Chart Pattern Recognition
- John Murphy's Market Message
- MurphyExplainsMarketAnalysis-Intermarket Analysis
- MurphyExplainsMarketAnalysis-Visual Analysis
- StockCharts.com
- Technical Analysis of the Financial Markets
- The Visual Investor
- VectorVest, Inc.
- Executive Premier Workshop
- One-Day Options Course
- OptionsPro
- Retirement Income Workshop
- Sure-Fire Trading Systems (VectorVest, Inc.)
- Trading as a Business Workshop
- VectorVest 7 EOD
- VectorVest 7 RealTime/IntraDay
- VectorVest AutoTester
- VectorVest Educational Services
- VectorVest OnLine
- VectorVest Options Analyzer
- VectorVest ProGraphics v6.0
- VectorVest ProTrader 7
- VectorVest RealTime Derby Tool
- VectorVest Simulator
- VectorVest Variator
- VectorVest Watchdog
