

HOT TOPICS LIST
- MACD
- Fibonacci
- RSI
- Gann
- ADXR
- Stochastics
- Volume
- Triangles
- Futures
- Cycles
- Volatility
- ZIGZAG
- MESA
- Retracement
- Aroon
INDICATORS LIST
LIST OF TOPICS
PRINT THIS ARTICLE
by Ron Walker
A morning star candlestick is shining brightly on the S&P 500, which might be a "shining star" for the market.
Position: N/A
Ron Walker
Ron Walker is an active trader and technical analyst. He operates an educational website dedicated to the study of Technical Analysis. The website offers free market analysis with daily video presentations and written commentaries. Ron is a video pioneer, being one of the first to utilize the internet producing Technical Analysis videos. His website is thechartpatterntrader.com
PRINT THIS ARTICLE
CANDLESTICK CHARTING
A Shining Star On The S&P 500
03/19/08 08:53:53 AMby Ron Walker
A morning star candlestick is shining brightly on the S&P 500, which might be a "shining star" for the market.
Position: N/A
| As Earth, Wind, and Fire sang in its hit "Shining Star," "Shining star come into view, Shine its watchful light on you," a morning star candle is shining on the S&P 500. |
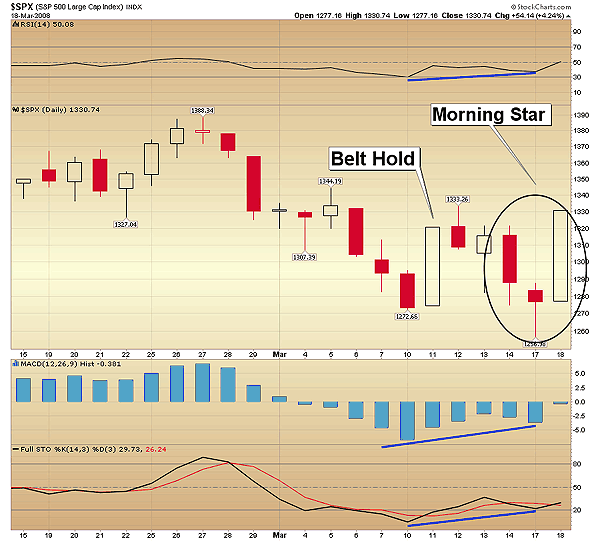
| On March 11, the Standard & Poor's 500 formed a bullish reversal candlestick called a belt hold, as seen in Figure 1. The massive white-bodied belt hold candlestick pattern is very distinct, in that it opens at or near the lows and closes near the highs of the session. One of the characteristics of the belt hold single-day pattern is an absence of any lower shadow on the candlestick. The elongated candlestick makes its appearance after prices have been in a down swing for some time. The belt hold pattern essentially halts the previous downtrend, as buyers come back into the market. The pattern must be confirmed by a close above the highest high of the pattern. In this case, the pattern didn't yield any considerable follow-through to the upside. Therefore, the pattern was not confirmed because prices never closed above the 1320 peak of the pattern. After that, prices then deteriorated back down to test the 1272 closing low that was made on March 10. |
|
| FIGURE 1: S&P 500, DAILY. After prices failed to confirm the belt hold reversal pattern on March 11, another reversal pattern emerged called a morning star. The gap that formed on the NASDAQ was much wider than the one-point gap seen here on the S&P 500. |
| Graphic provided by: StockCharts.com. |
| |
| I continued to watch for clues in expectation that another reversal pattern would emerge because the belt hold pattern failed. Another possibility presented itself just four trading sessions after the belt hold pattern appeared on the scene. On March 17, prices opened lower and sifted below the previous 1270 intraday low made on January 23, 2008 (see Figure 1). Support waned throughout the day, making a new intraday low of 1256, but prices managed to close significantly off the lows of the day at 1276. This set up another possible reversal pattern known as a morning star. This is a three-day candlestick reversal pattern. The first day is a long black day that moves prices lower in the direction of the prevailing trend. The second day, a star forms that gaps away from the body of the first day, representing indecision among traders. The second day produces a small real body, but the candlestick color of the second day is irrelevant. On the third day, a long white-bodied candlestick forms and rises back into the black body of the first day of the pattern and sometimes exceeds it. This candlestick usually gaps higher at the open. Confirmation of the pattern comes when prices close above the intraday peak of the pattern. This reversal pattern materializes after a significant downtrend has been in place. It signals that the impending downtrend is going to change. |
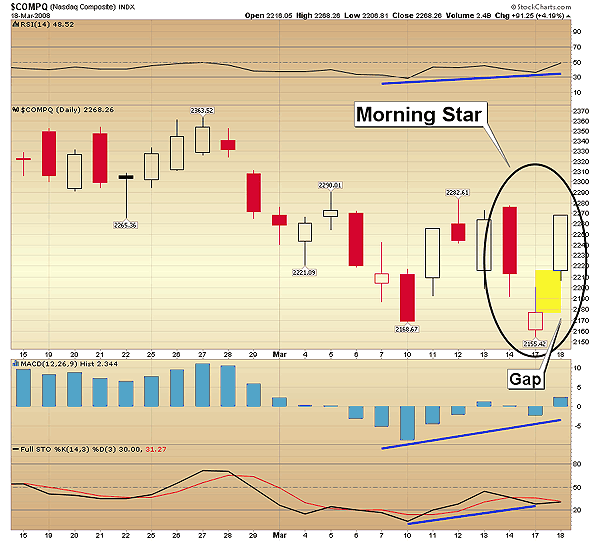
| In Figure 1, the following day, on March 18, prices slightly gapped up at the open and rose sharply for the rest of the session. Prices managed to close above the black body of the first day. The deeper the retracement moves into or above the first candlestick's real body, the stronger the recovery is expected to be. In this example, the third candlestick did gap up but only by one point. In Figure 2, the NASDAQ, which formed the same pattern at this time, had a much wider gap between the second and third candlesticks. Should this bring the S&P 500 pattern into question? Greg Morris, in his book Candlestick Charting Explained, expounds on flexibility of the pattern: "Ideally there is one gap between the bodies of the first candlestick and the star, and a second gap between the bodies of the star and third candlestick. Some flexibility is possible in the gap between the star and the third day." So the gap between the first day and the second day are much more important, regardless if the third day significantly gaps up or not. The morning star patterns that appear on the two averages both meet the criteria set forth in Morris's book, but he stresses the importance of the pattern receiving confirmation in order to have validity. |
|
| FIGURE 2: NASDAQ, DAILY. The morning star pattern on the NASDAQ didn't exceed the candlestick high from the first day, like the S&P 500 did. The NASDAQ produced a very wide gap between the second and third days of the pattern, highlighted here in yellow. |
| Graphic provided by: StockCharts.com. |
| |
Ron Walker is an active trader and technical analyst. He operates an educational website dedicated to the study of Technical Analysis. The website offers free market analysis with daily video presentations and written commentaries. Ron is a video pioneer, being one of the first to utilize the internet producing Technical Analysis videos. His website is thechartpatterntrader.com
| Website: | thechartpatterntrader.com |
| E-mail address: | thechartpatterntrader@gmail.com |
Click here for more information about our publications!
Comments
Date:�03/19/08Rank:�3Comment:�

Request Information From Our Sponsors
- StockCharts.com, Inc.
- Candle Patterns
- Candlestick Charting Explained
- Intermarket Technical Analysis
- John Murphy on Chart Analysis
- John Murphy's Chart Pattern Recognition
- John Murphy's Market Message
- MurphyExplainsMarketAnalysis-Intermarket Analysis
- MurphyExplainsMarketAnalysis-Visual Analysis
- StockCharts.com
- Technical Analysis of the Financial Markets
- The Visual Investor
- VectorVest, Inc.
- Executive Premier Workshop
- One-Day Options Course
- OptionsPro
- Retirement Income Workshop
- Sure-Fire Trading Systems (VectorVest, Inc.)
- Trading as a Business Workshop
- VectorVest 7 EOD
- VectorVest 7 RealTime/IntraDay
- VectorVest AutoTester
- VectorVest Educational Services
- VectorVest OnLine
- VectorVest Options Analyzer
- VectorVest ProGraphics v6.0
- VectorVest ProTrader 7
- VectorVest RealTime Derby Tool
- VectorVest Simulator
- VectorVest Variator
- VectorVest Watchdog