HOT TOPICS LIST
- MACD
- Fibonacci
- RSI
- Gann
- ADXR
- Stochastics
- Volume
- Triangles
- Futures
- Cycles
- Volatility
- ZIGZAG
- MESA
- Retracement
- Aroon
INDICATORS LIST
LIST OF TOPICS
PRINT THIS ARTICLE
by Mike Carr, CMT
The DeMark sequential is set up to provide a potential buy signal in the SPY.
Position: Buy
Mike Carr, CMT
Mike Carr, CMT, is a member of the Market Technicians Association, and editor of the MTA's newsletter, Technically Speaking. He is also the author of "Smarter Investing in Any Economy: The Definitive Guide to Relative Strength Investing," and "Conquering the Divide: How to Use Economic Indicators to Catch Stock Market Trends."
PRINT THIS ARTICLE
STRATEGIES
Are We Finally at a Bottom? SPY Buy Setup
03/19/08 08:31:56 AMby Mike Carr, CMT
The DeMark sequential is set up to provide a potential buy signal in the SPY.
Position: Buy
| Tom DeMark has been developing technical trading indicators and systems for decades. He has consulted with the greatest traders in the world, including hedge fund legends like Steve Cohen. The sequential is a complex pattern that often identifies exhaustion points in trends, helping traders enter at the reversal point. |
| Sequential begins with a setup. The close is compared to the close of four sessions ago. For a buy signal, when there are nine consecutive closes where the close is less than the close of four bars ago, the setup is complete. |
| After a market is set up, the countdown begins. The count increases by one whenever the close is lower than the close two bars ago. When the count reaches 13, the market is obviously deeply oversold and we look for a buy signal. The buy occurs the first time the market closes higher than the close four bars ago, indicating that the trend may have reversed. |
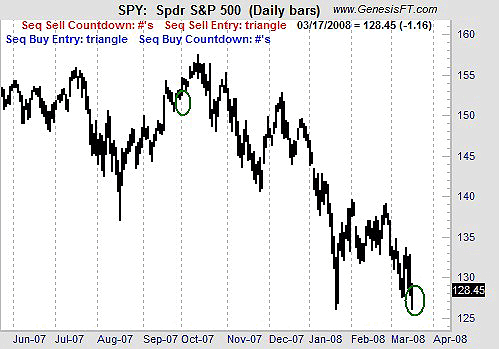
| On March 14, the SPY reached a 13 count (Figure 1). The buy signal will be triggered with a close above 129.62. The signal will be negated if there is a resumption of the downtrend, marked by nine closes where the price is lower than it was four bars ago. |

|
| FIGURE 1: SPY. The SPY is set up for a possible DeMark sequential buy signal. The last occurrence, in September 2007, resulted in a small profit. |
| Graphic provided by: Trade Navigator. |
| |
| The DeMark sequential is an indicator widely followed by market professionals. With stocks being deeply oversold, it is an indicator worth watching for a buy signal. If it occurs, the indicator would coincide with a double bottom on the SPY, and should lead to a profitable trading opportunity. |
Mike Carr, CMT, is a member of the Market Technicians Association, and editor of the MTA's newsletter, Technically Speaking. He is also the author of "Smarter Investing in Any Economy: The Definitive Guide to Relative Strength Investing," and "Conquering the Divide: How to Use Economic Indicators to Catch Stock Market Trends."
| Website: | www.moneynews.com/blogs/MichaelCarr/id-73 |
| E-mail address: | marketstrategist@gmail.com |
Click here for more information about our publications!
Comments
Date: 03/19/08Rank: 3Comment:

Request Information From Our Sponsors
- VectorVest, Inc.
- Executive Premier Workshop
- One-Day Options Course
- OptionsPro
- Retirement Income Workshop
- Sure-Fire Trading Systems (VectorVest, Inc.)
- Trading as a Business Workshop
- VectorVest 7 EOD
- VectorVest 7 RealTime/IntraDay
- VectorVest AutoTester
- VectorVest Educational Services
- VectorVest OnLine
- VectorVest Options Analyzer
- VectorVest ProGraphics v6.0
- VectorVest ProTrader 7
- VectorVest RealTime Derby Tool
- VectorVest Simulator
- VectorVest Variator
- VectorVest Watchdog
- StockCharts.com, Inc.
- Candle Patterns
- Candlestick Charting Explained
- Intermarket Technical Analysis
- John Murphy on Chart Analysis
- John Murphy's Chart Pattern Recognition
- John Murphy's Market Message
- MurphyExplainsMarketAnalysis-Intermarket Analysis
- MurphyExplainsMarketAnalysis-Visual Analysis
- StockCharts.com
- Technical Analysis of the Financial Markets
- The Visual Investor
