HOT TOPICS LIST
- MACD
- Fibonacci
- RSI
- Gann
- ADXR
- Stochastics
- Volume
- Triangles
- Futures
- Cycles
- Volatility
- ZIGZAG
- MESA
- Retracement
- Aroon
INDICATORS LIST
LIST OF TOPICS
PRINT THIS ARTICLE
by Chaitali Mohile
BSE Sensex, the benchmark, is among the worst underperformers in emerging markets and even across the globe.
Position: Sell
Chaitali Mohile
Active trader in the Indian stock markets since 2003 and a full-time writer. Trading is largely based upon technical analysis.
PRINT THIS ARTICLE
BULL/BEAR MARKET
The Bombay Stock Exchange: The Worst-Hit Index?
03/26/08 10:35:21 AMby Chaitali Mohile
BSE Sensex, the benchmark, is among the worst underperformers in emerging markets and even across the globe.
Position: Sell
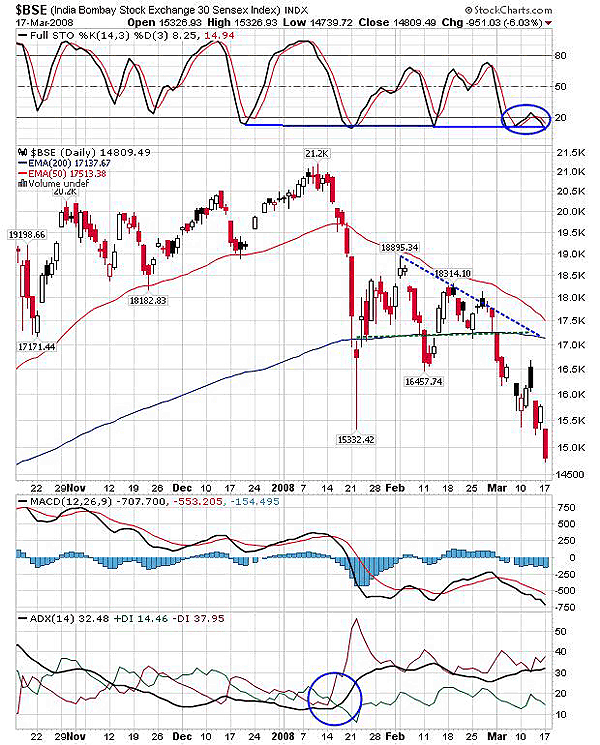
| The past three years were the best growth potential years for the Indian economy and the Sensex. The 30 Sensex Index, the benchmark, marked its all-time high at 21,200 from its lows of 9,000/10,000. Along with the hot winds of weak financial markets in the US, the financial markets across the world will probably enter a bearish phase. And $BSE doesn't have a different story. It too fears the bearish phase. The index is already down almost 20% and may continue further. Recently $BSE cracked below the January low of 15332 (psychological support). The daily chart in Figure 1 shows that after a prolonged fall from the highs of 21,200, the index traded below its 200-day moving average resistance with the support of the 50-day moving average. The 200-day MA support getting converted to resistance was itself an alarming sign of a bearish phase along with bad news pouring in around the world. |

|
| FIGURE 1: BOMBAY STOCK EXCHANGE INDEX, DAILY. The bloodbath may continue, even though the target on a descending triangle may have been achieved. The indicators are highly bearish, but an oversold stochastic can hardly bring any relief rally. |
| Graphic provided by: StockCharts.com. |
| |
| The support and resistance of two MAs formed the range trading consolidation at lower levels, and eventually a descending triangle was formed. This pattern was heart-breaking, as it suggested more downside with the breakout. Since the breakout, the index has tumbled almost 2,000, so it's needless to count the target on breakout. But it does not mean that the slump is over. Though the stochastic (14,3,3) is oversold on charts, and previously rallied back from the same support, the present sentiments are negative. Instead, the situation is shorting with every pullback. |
| The average directional movement index (ADX) (14) is indicating a well-developed downtrend with rock-solid selling pressure. And the moving average convergence/divergence (MACD) (12,26,9) seems to have settled down in negative territory, suggesting more weakness in the coming days. A nominal pullback would not bring back the confidence amid the traders to enter any long positions. The bears are spreading their hands on the long-term trend too. |

|
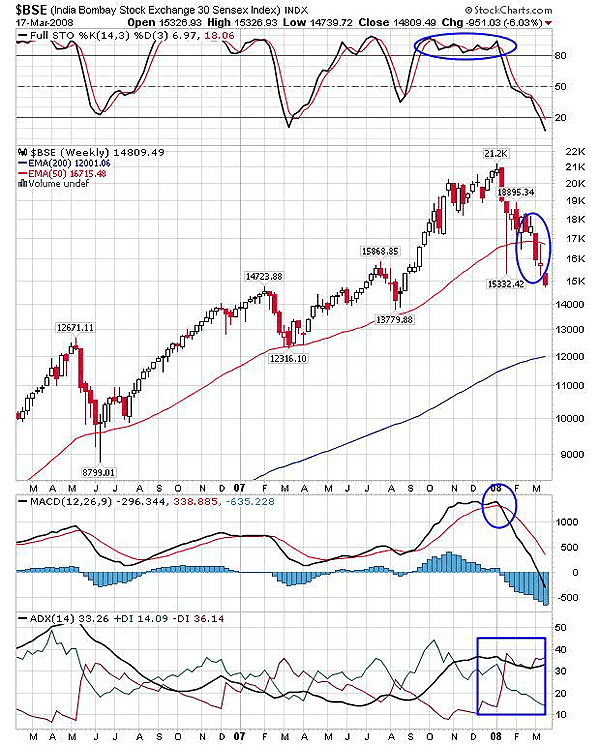
| FIGURE 2: BOMBAY STOCK EXCHANGE INDEX, WEEKLY. Trading below the 200-day moving average lowers the expectations of traders, and therefore any upside rally with the effect of an oversold stochastic will be hit back by the resistance line. |
| Graphic provided by: StockCharts.com. |
| |
| Figure 2, the weekly chart, would help to understand the potential supports for the current turbulence on the Sensex. Below the January low, the earlier supports initiating the pullback rallies can be seen as strong support as well. The stochastic on the weekly chart is oversold too, so some recovery can be expected for a day or two. These visiting bullish rallies are again a good opportunity to sell on rallies. So buying on dips is currently out of the norm for traders. The previous support of 13779 can get tested in the worst scenario. The other two indicators are highly bearish with no distinctive sign for a bullish day, and even if some recovery appears, the 200-day MA would act as the strongest resistance on technical terms. |
| Thus, the $BSE is curtailing all hopes of traders and entering the bearish phase. The slowdown in the economies across the world is on the cards now. |
Active trader in the Indian stock markets since 2003 and a full-time writer. Trading is largely based upon technical analysis.
| Company: | Independent |
| Address: | C1/3 Parth Indraprasth Towers. Vastrapur |
| Ahmedabad, Guj 380015 | |
| E-mail address: | chaitalimohile@yahoo.co.in |
Traders' Resource Links | |
| Independent has not added any product or service information to TRADERS' RESOURCE. | |
Click here for more information about our publications!
Comments
Date: 03/30/08Rank: 3Comment:

Request Information From Our Sponsors
- StockCharts.com, Inc.
- Candle Patterns
- Candlestick Charting Explained
- Intermarket Technical Analysis
- John Murphy on Chart Analysis
- John Murphy's Chart Pattern Recognition
- John Murphy's Market Message
- MurphyExplainsMarketAnalysis-Intermarket Analysis
- MurphyExplainsMarketAnalysis-Visual Analysis
- StockCharts.com
- Technical Analysis of the Financial Markets
- The Visual Investor
- VectorVest, Inc.
- Executive Premier Workshop
- One-Day Options Course
- OptionsPro
- Retirement Income Workshop
- Sure-Fire Trading Systems (VectorVest, Inc.)
- Trading as a Business Workshop
- VectorVest 7 EOD
- VectorVest 7 RealTime/IntraDay
- VectorVest AutoTester
- VectorVest Educational Services
- VectorVest OnLine
- VectorVest Options Analyzer
- VectorVest ProGraphics v6.0
- VectorVest ProTrader 7
- VectorVest RealTime Derby Tool
- VectorVest Simulator
- VectorVest Variator
- VectorVest Watchdog
