HOT TOPICS LIST
- MACD
- Fibonacci
- RSI
- Gann
- ADXR
- Stochastics
- Volume
- Triangles
- Futures
- Cycles
- Volatility
- ZIGZAG
- MESA
- Retracement
- Aroon
INDICATORS LIST
LIST OF TOPICS
PRINT THIS ARTICLE
by Mike Carr, CMT
After stepping in to buy Bear Stearns, JP Morgan stands to profit if the worst is over.
Position: Buy
Mike Carr, CMT
Mike Carr, CMT, is a member of the Market Technicians Association, and editor of the MTA's newsletter, Technically Speaking. He is also the author of "Smarter Investing in Any Economy: The Definitive Guide to Relative Strength Investing," and "Conquering the Divide: How to Use Economic Indicators to Catch Stock Market Trends."
PRINT THIS ARTICLE
STRATEGIES
The Bullish Case For JP Morgan
03/18/08 09:58:30 AMby Mike Carr, CMT
After stepping in to buy Bear Stearns, JP Morgan stands to profit if the worst is over.
Position: Buy
| The news is filled with the story of Bear Stearns. Every trader knows that derivatives and hedge fund exposure created a cash crisis for the company, requiring a Federal Reserve bailout. Every trader should also be aware of what analyst John Murphy and others have defined as the three core principles that define technical analysis. These ideas are that (1) share prices move in patterns; (2) patterns repeat themselves; and (3) if you anticipate a pattern correctly, you can profit from it. At times, we look too much at charts and forget to think about the history of the markets, which often repeats itself. |
| JP Morgan (JPM) is at the center of the current bailout, just as John Pierpont Morgan found himself at the center of the panic of 1907. By the autumn of 1907, the stock market was down nearly 50% from its peak the previous year and the economy was in recession. The problems were caused by a credit crisis, as banks moved to tighten lending standards after speculative excesses earlier in the century. |
| In October 1907, a crash occurred that was caused by a single speculator using borrowed funds and too much leverage in an attempt to corner the market in a stock called United Copper. Knickerbocker Trust, the bank that made the loans, suffered a liquidity crisis. The looming failure of this bank threatened the entire financial system. US Treasury Secretary George Cortelyou provided $35 million of federal money to ease the crisis. He also enlisted the help of banker JP Morgan. Teaming up with other bankers, Morgan redirected money between banks, found additional sources of credit, and bought oversold stocks of healthy companies. Within weeks the panic was over. |

|
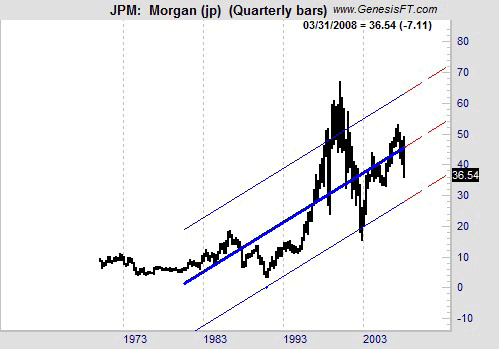
| FIGURE 1: JPM, QUARTERLY. This chart of JP Morgan shows that price is approaching support. |
| Graphic provided by: Trade Navigator. |
| |
| Will history repeat? There is room for optimism related to JPM (the stock, not the original financier). Figure 1 is a quarterly chart that allows us to get more perspective. The linear regression channel line has contained declines over the past 20 years. This chart shows a downside target of 30 for JPM, about 20% from current levels. If long-term support like this is violated, the likelihood of a significant bear market is very real. However, that is unlikely given the current fundamentals. |

|
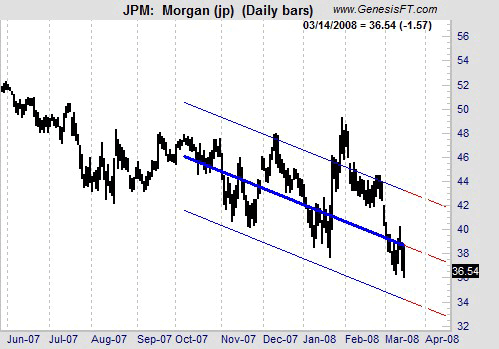
| FIGURE 2: JPM, DAILY. This chart of JPM shows a downtrend, but a break above resistance at 40 would be a buying opportunity. |
| Graphic provided by: Trade Navigator. |
| |
| The daily chart (Figure 2) is even more supportive. Price is within $2.00 of the lower regression channel line. Above 40, the pattern turns bullish, allowing traders to place a low-risk stop-entry order. The negative news provides a wall of worry for price to climb. Risk for traders can be contained while betting that JPM may once again be acting near the low to steady the markets. |
Mike Carr, CMT, is a member of the Market Technicians Association, and editor of the MTA's newsletter, Technically Speaking. He is also the author of "Smarter Investing in Any Economy: The Definitive Guide to Relative Strength Investing," and "Conquering the Divide: How to Use Economic Indicators to Catch Stock Market Trends."
| Website: | www.moneynews.com/blogs/MichaelCarr/id-73 |
| E-mail address: | marketstrategist@gmail.com |
Click here for more information about our publications!
Comments
Date: 03/18/08Rank: 5Comment:

Request Information From Our Sponsors
- StockCharts.com, Inc.
- Candle Patterns
- Candlestick Charting Explained
- Intermarket Technical Analysis
- John Murphy on Chart Analysis
- John Murphy's Chart Pattern Recognition
- John Murphy's Market Message
- MurphyExplainsMarketAnalysis-Intermarket Analysis
- MurphyExplainsMarketAnalysis-Visual Analysis
- StockCharts.com
- Technical Analysis of the Financial Markets
- The Visual Investor
- VectorVest, Inc.
- Executive Premier Workshop
- One-Day Options Course
- OptionsPro
- Retirement Income Workshop
- Sure-Fire Trading Systems (VectorVest, Inc.)
- Trading as a Business Workshop
- VectorVest 7 EOD
- VectorVest 7 RealTime/IntraDay
- VectorVest AutoTester
- VectorVest Educational Services
- VectorVest OnLine
- VectorVest Options Analyzer
- VectorVest ProGraphics v6.0
- VectorVest ProTrader 7
- VectorVest RealTime Derby Tool
- VectorVest Simulator
- VectorVest Variator
- VectorVest Watchdog
