HOT TOPICS LIST
- MACD
- Fibonacci
- RSI
- Gann
- ADXR
- Stochastics
- Volume
- Triangles
- Futures
- Cycles
- Volatility
- ZIGZAG
- MESA
- Retracement
- Aroon
INDICATORS LIST
LIST OF TOPICS
PRINT THIS ARTICLE
by Dennis D. Peterson
One enigma remains elusive and another less so.
Position: N/A
Dennis D. Peterson
Market index trading on a daily basis.
PRINT THIS ARTICLE
GANN
Gann And Fibonnacci (Part II of III)
04/06/01 02:42:24 PMby Dennis D. Peterson
One enigma remains elusive and another less so.
Position: N/A
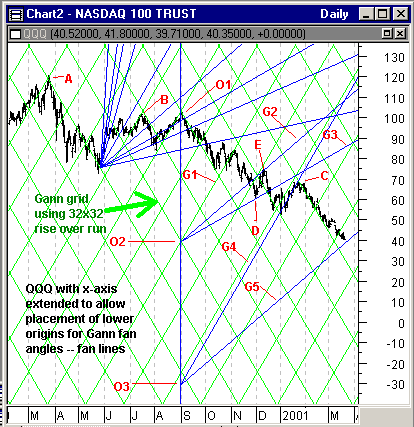
| W.D. Gann used charting paper that lent itself to use equal rise and run when charting price and time. The alternative to this is to create a grid superimposed on a computer software generated price/time chart, which is sized to fill the window you have created on your screen. The superimposed grid, as you might expect, will not be square if the visual picture you start with is not square (equal rise and run). Following the rule of attaching a fan to a major or intermediate top or bottom I attached the grid origin, labeled as point O1 on Figure 1, to the September 1, 2000 peak. |
| From practice I have found that stocks with a 100-point range seem to work best on my 17-inch screen. Figure 1 shows a Gann grid (green) superimposed on a standard arithmetic price/time chart. The grid size is 32 x 32. |

|
| Figure 1: QQQ (AMEX: Nasdaq top 100 stocks) price annotated with Gann grid (green), Gann lines (blue). |
| Graphic provided by: MetaStock. |
| Graphic provided by: Data vendor: eSignal<. |
| |
| Points A and B happen to coincide with grid intersections. Point C almost does as well. The coinciding of A, B, and C with grid intersections are a result of picking a cycle of 32. The fact that at points A, B, and C the grid lines form trend support and resistance is due to making the rise equal to the run, or due to a Gann approach. If you attach a Gann fan from the September 1, 2000 peak you will have the Gann fan lines of resistance and support for downtrends. You can't see any uptrend resistance or support unless you find a bottom to attach Gann fan angles -- or use an alternative. The alternative is to draw a vertical line through the peak at September and then find an intersection of a major uptrend, using Gann angles, and the vertical line. Hopefully that line is the Gann 1 x 1. Grid line G1 seems to be a candidate, although a weak one, since there is so little uptrend to match (not much of a surprise in this bear market). I next attach a single Gann fan line at O2. O2 is the point of intersection of the vertical line with a Gann angle line (which happens, in this case, to be grid line G1 as well that shows resistance support to an uptrend). The math I am using for Gann uptrends is the lower Gann angles of 45, 26.25, 18.75, 15, and 7.5 degrees. I take the tangent of each angle and multiply by 32 to get rise. Rise values for a run of 32 are therefore 1, 15.78, 10.86, 8.75, and 4.21. I now manually attach and draw two Gann angle lines. By coincidence the downtrend comes to a momentary retracement at point D, which is on the 16.75 degree Gann angle line (Figure 1: Gann angle line G3) and then meets resistance at point E, which is on the 26.25 degree Gann angle line (Figure 1: Gann angle line G2). G1 is a weak choice because the uptrend is so short. Line G4 is a stronger candidate since there are more price tags of resistance for this longer uptrend. Line G5 is drawn from origin O3, which is the intersection of G4 with the vertical line going through the September peak. This predicts that around March 26 or so that QQQ will hit 40 or so and then meet some support. |
Market index trading on a daily basis.
| Title: | Staff Writer |
| Company: | Technical Analysis, Inc. |
| Address: | 4757 California Ave SW |
| Seattle, WA 98116-4499 | |
| Phone # for sales: | 206 938 0570 |
| Fax: | 206 938 1307 |
| Website: | www.traders.com |
| E-mail address: | dpeterson@traders.com |
Traders' Resource Links | |
| Charting the Stock Market: The Wyckoff Method -- Books | |
| Working-Money.com -- Online Trading Services | |
| Traders.com Advantage -- Online Trading Services | |
| Technical Analysis of Stocks & Commodities -- Publications and Newsletters | |
| Working Money, at Working-Money.com -- Publications and Newsletters | |
| Traders.com Advantage -- Publications and Newsletters | |
| Professional Traders Starter Kit -- Software | |
Click here for more information about our publications!
Comments

Request Information From Our Sponsors
- StockCharts.com, Inc.
- Candle Patterns
- Candlestick Charting Explained
- Intermarket Technical Analysis
- John Murphy on Chart Analysis
- John Murphy's Chart Pattern Recognition
- John Murphy's Market Message
- MurphyExplainsMarketAnalysis-Intermarket Analysis
- MurphyExplainsMarketAnalysis-Visual Analysis
- StockCharts.com
- Technical Analysis of the Financial Markets
- The Visual Investor
- VectorVest, Inc.
- Executive Premier Workshop
- One-Day Options Course
- OptionsPro
- Retirement Income Workshop
- Sure-Fire Trading Systems (VectorVest, Inc.)
- Trading as a Business Workshop
- VectorVest 7 EOD
- VectorVest 7 RealTime/IntraDay
- VectorVest AutoTester
- VectorVest Educational Services
- VectorVest OnLine
- VectorVest Options Analyzer
- VectorVest ProGraphics v6.0
- VectorVest ProTrader 7
- VectorVest RealTime Derby Tool
- VectorVest Simulator
- VectorVest Variator
- VectorVest Watchdog
