

HOT TOPICS LIST
- MACD
- Fibonacci
- RSI
- Gann
- ADXR
- Stochastics
- Volume
- Triangles
- Futures
- Cycles
- Volatility
- ZIGZAG
- MESA
- Retracement
- Aroon
INDICATORS LIST
LIST OF TOPICS
PRINT THIS ARTICLE
by Koos van der Merwe
The market has been hit by bad news almost every day. When will the market calm down?
Position: Buy
Koos van der Merwe
Has been a technical analyst since 1969, and has worked as a futures and options trader with First Financial Futures in Johannesburg, South Africa.
PRINT THIS ARTICLE
OSCILLATORS
Market Volatility Alarms Participants
03/19/08 09:23:32 AMby Koos van der Merwe
The market has been hit by bad news almost every day. When will the market calm down?
Position: Buy
| We saw the market fall again despite a midweek rally. Last Friday, we saw sharp losses on the news that investment bank Bear Stearns had been forced to accept a bailout package after a client exodus and reduced access to credit. JP Morgan has agreed to pay $2.00 per share for the company. What did not make the headlines was that the CPI showed no inflationary increase from January to February, leading the US Federal Reserve to cut rates by a further 0.75%. |
| With Fed chaiman Ben Bernanke's attempts to limit market losses, will he succeed? I believe that he will. The market is close to bottoming, but the recovery will be slow and painful, and last well into 2011 or 2012. I believe that a very shallow saucer-shaped recovery will start forming on the charts. The days of 12% to 20% returns on our portfolios are now over, and the more conservative 2% to 3% will now become the order of the day. See Figure 1. |
|
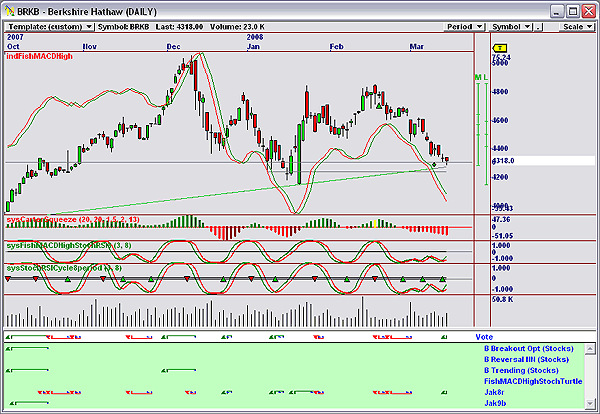
| FIGURE 1: VOTE LINE. Here's the vote line giving a buy signal. |
| Graphic provided by: Nirvana Systems. Omnitrader.. |
| |
| When should we start becoming the contrarian and start buying? Blood is already running freely in the streets; the Bear Stearns fiasco is an example, with many more disasters still to appear. One way to help you decide is to follow the investment strategy of the richest man in the world, Warren Buffett, and the easiest way to follow him is to keep an eye on the price of Berkshire Hathaway (BRKB). |
|
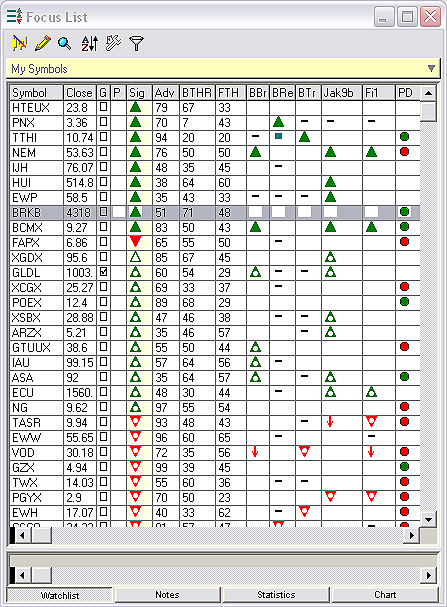
| FIGURE 2: THE FOCUS LIST. The focus list is highlighting the parameters that filter Berkshire Hathaway B-shares as a buy. |
| Graphic provided by: Omnitrader. |
| |
| Figure 2 is that of Berkshire Hathaway B-shares, simply because they are priced much cheaper than the A-share and therefore shows a trend far more easily. The chart has given a buy signal for Berkshire Hathaway B-shares and shows the following indicators that are all a part of my final strategy: a. In the chart itself is the Fisher MACD of the highs. This indicator is still pointing down, suggesting weakness, but it is a lagging indicator. I use it mainly as a stop, to get out of a position should the vote line be late in offering a stop. b. A trendline. The price has touched that line and reversed in a hanging man candlestick formation — a good buy signal. c. A chart of the following strategies: - The Carter squeeze strategy, which is suggesting oversold levels and is ready to turn up. - A stochastic RSI combined with the Fisher MACD high indicator. This strategy is showing oversold levels but has not yet given a buy signal. - A stochastic RSI cycle eight-period indicator that has given a buy signal. - Volume, which has started to show a bit of strength as the price recovered, but nothing of importance ... yet. - The vote line giving the final summation of all the strategies I have implemented and used in the program — viz. wit, B Breakout OPT (Stocks); B Reversal NN (Stocks); B Trending (Stocks); Fish MACDHighStochTurtle; Jak8r and Jak9b. The JAK8r is the strategy that triggered the present vote line signal. Finally, I used a filter as shown in the focus list shown in Figure 2. - ADV is the Advisor rating of a signal. For a signal to be acceptable, it must be greater than 50. - BTHR is the Back Test Hit Rate, which must be greater than 70. - FTHR is the Forward Test Hit Rate, which must be greater than 100. I will accept either a FTHR with and ADV rating, or a BTHR with an ADV rating. For Berkshire Hathaway, (BRKB) the BTHR is 71 and the ADV is 51. |
| Berkshire Hathaway B-shares has given me a buy signal. This suggests to me that shrewd investors believe that Warren Buffett is using the slowdown in the market to accumulate shares that have fallen too far, too fast. To take advantage of Buffett's acumen, one should add Berkshire Hathaway to one's portfolio. |
Has been a technical analyst since 1969, and has worked as a futures and options trader with First Financial Futures in Johannesburg, South Africa.
| Address: | 3256 West 24th Ave |
| Vancouver, BC | |
| Phone # for sales: | 6042634214 |
| E-mail address: | petroosp@gmail.com |
Click here for more information about our publications!
Comments
Date:�03/19/08Rank:�3Comment:�

Request Information From Our Sponsors
- StockCharts.com, Inc.
- Candle Patterns
- Candlestick Charting Explained
- Intermarket Technical Analysis
- John Murphy on Chart Analysis
- John Murphy's Chart Pattern Recognition
- John Murphy's Market Message
- MurphyExplainsMarketAnalysis-Intermarket Analysis
- MurphyExplainsMarketAnalysis-Visual Analysis
- StockCharts.com
- Technical Analysis of the Financial Markets
- The Visual Investor
- VectorVest, Inc.
- Executive Premier Workshop
- One-Day Options Course
- OptionsPro
- Retirement Income Workshop
- Sure-Fire Trading Systems (VectorVest, Inc.)
- Trading as a Business Workshop
- VectorVest 7 EOD
- VectorVest 7 RealTime/IntraDay
- VectorVest AutoTester
- VectorVest Educational Services
- VectorVest OnLine
- VectorVest Options Analyzer
- VectorVest ProGraphics v6.0
- VectorVest ProTrader 7
- VectorVest RealTime Derby Tool
- VectorVest Simulator
- VectorVest Variator
- VectorVest Watchdog