HOT TOPICS LIST
- MACD
- Fibonacci
- RSI
- Gann
- ADXR
- Stochastics
- Volume
- Triangles
- Futures
- Cycles
- Volatility
- ZIGZAG
- MESA
- Retracement
- Aroon
INDICATORS LIST
LIST OF TOPICS
PRINT THIS ARTICLE
by Gary Grosschadl
With the gold price at the doorstep of $1,000 per ounce, it makes me want to look back and see if that possibility was reflected on earlier charts.
Position: Hold
Gary Grosschadl
Independent Canadian equities trader and technical analyst based in Peterborough
Ontario, Canada.
PRINT THIS ARTICLE
ANDREWS PITCH-FORK
Gold's Super Bull Move
03/18/08 11:16:07 AMby Gary Grosschadl
With the gold price at the doorstep of $1,000 per ounce, it makes me want to look back and see if that possibility was reflected on earlier charts.
Position: Hold
| I remember back in 2005 trying to figure where the gold price was going. Chartwise it was difficult because the gold price was reaching 20-year highs, hitting $540. I reasoned it was easier to look at the Gold & Silver Index ($XAU) as it was below 10-year highs. I wrote at the time, "With the gold price striking $540 in recent days, the previous high-water mark of $840 (in the early 1980s) seems too unlikely a future target." Hitting that target, never mind eclipsing it, seemed at the time way too outlandish to consider. Check out my article at 12/29/05, "This Gold Index Shows More Upside." |
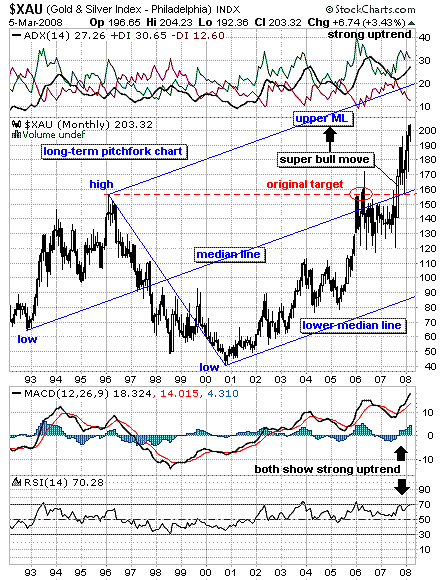
| At that time I did a long-term monthly pitchfork chart (the Andrews pitchfork or the Andrews line method). Figure 1 is updated here and shows a rare bullish thrust on this type of chart. Typically in pitchfork theory, we assume a bullish move normally eventually thrusts to the median line target (center median line) and then retraces to below the line. A super bull move, on the other hand, would entail a much bigger move to target the upper median line (I have not seen very many of these and can't recall the last one I saw). |

|
| FIGURE 1: $XAU, MONTHLY. A 15-year chart shows the Gold & Silver Index eclipsing the previous high via a pitchfork chart. |
| Graphic provided by: StockCharts.com. |
| |
| On this chart the original target (from the previous analysis of December 2005) was the median line, which roughly corresponded to the previous high of 1996. After that median line was hit, a consolidation period set in of about 18 months. Then a breakout move occured in the latter part of 2007, boldly thrusting above the median line once again. This signaled the start of a bigger move toward the upper median line. |
| This view certainly entertains a thrust to $1,000 per ounce gold price if not a spike beyond. Whether this coincides with a strike of the upper median line remains to be seen. After such a bold move, a large move back down to test the center median line should not surprise as feverish profit taking could set in. What happens then could swing either way, either a resumption of the previous upthrust or a more serious down leg toward the lower median line. |
Independent Canadian equities trader and technical analyst based in Peterborough
Ontario, Canada.
| Website: | www.whatsonsale.ca/financial.html |
| E-mail address: | gwg7@sympatico.ca |
Click here for more information about our publications!
Comments
Date: 03/18/08Rank: 2Comment:

Request Information From Our Sponsors
- StockCharts.com, Inc.
- Candle Patterns
- Candlestick Charting Explained
- Intermarket Technical Analysis
- John Murphy on Chart Analysis
- John Murphy's Chart Pattern Recognition
- John Murphy's Market Message
- MurphyExplainsMarketAnalysis-Intermarket Analysis
- MurphyExplainsMarketAnalysis-Visual Analysis
- StockCharts.com
- Technical Analysis of the Financial Markets
- The Visual Investor
- VectorVest, Inc.
- Executive Premier Workshop
- One-Day Options Course
- OptionsPro
- Retirement Income Workshop
- Sure-Fire Trading Systems (VectorVest, Inc.)
- Trading as a Business Workshop
- VectorVest 7 EOD
- VectorVest 7 RealTime/IntraDay
- VectorVest AutoTester
- VectorVest Educational Services
- VectorVest OnLine
- VectorVest Options Analyzer
- VectorVest ProGraphics v6.0
- VectorVest ProTrader 7
- VectorVest RealTime Derby Tool
- VectorVest Simulator
- VectorVest Variator
- VectorVest Watchdog
