HOT TOPICS LIST
- MACD
- Fibonacci
- RSI
- Gann
- ADXR
- Stochastics
- Volume
- Triangles
- Futures
- Cycles
- Volatility
- ZIGZAG
- MESA
- Retracement
- Aroon
INDICATORS LIST
LIST OF TOPICS
PRINT THIS ARTICLE
by Ron Walker
The broadening formation on the Dow Jones Transportation Average could act as a continuation pattern or a reversal.
Position: Hold
Ron Walker
Ron Walker is an active trader and technical analyst. He operates an educational website dedicated to the study of Technical Analysis. The website offers free market analysis with daily video presentations and written commentaries. Ron is a video pioneer, being one of the first to utilize the internet producing Technical Analysis videos. His website is thechartpatterntrader.com
PRINT THIS ARTICLE
The Transportation's Broadening Formation
03/14/08 08:56:05 AMby Ron Walker
The broadening formation on the Dow Jones Transportation Average could act as a continuation pattern or a reversal.
Position: Hold
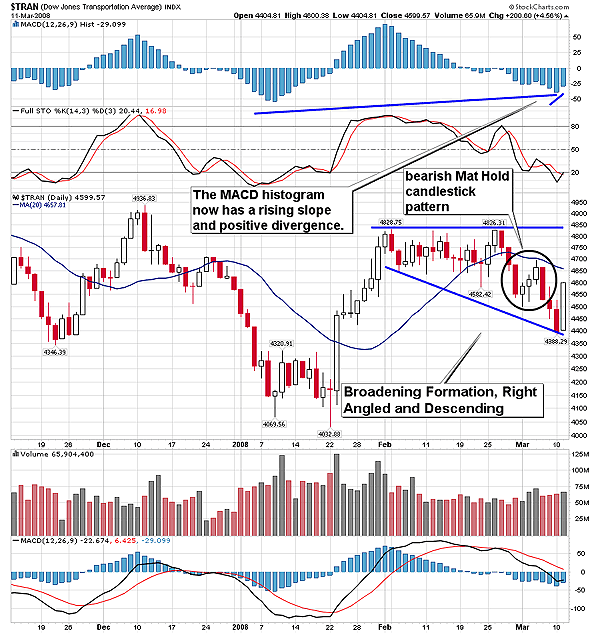
| Back in October 2007, when the Dow Jones Industrial Average (DJIA) and the Standard & Poor's 500 were making new all-time highs, the transportation average failed to follow suit. The transports meandered around during October and moved sideways for some time, until ultimately prices eroded along with the rest of the market after the October highs. As the market put the January lows, the transports was one of the sectors that led the charge toward recovery. The transportation index reaped huge gains as it catapulted higher, but then it ran into resistance in early February. Prices started forming a base, but after several attempts of trying to break above resistance, the bulls conceded to the bears. As seen in Figure 1, before breaking down near the end of February, the transportation index rose a whopping 19.70% off its January 22nd low of 4032 to a closing high of 4826, jumping up by 794 points. |

|
| FIGURE 1: DJTA, DAILY. In late January, the transportation index accelerated higher, finding resistance in February at the closing high of 4826. Prices broke down in late February as a bearish mat hold candlestick pattern developed, which continued to push prices lower, forming a broadening formation, a continuation pattern. |
| Graphic provided by: StockCharts.com. |
| |
| In late February, just two days after reaching its latest minor closing high of 4826.31, the transportation index closed below its 20-day simple moving average for the first time since the confirmation of its reversal on January 22. From there prices sifted lower, putting in a new minor low. Four days later, buyers came back into the market, breaking the three-day losing streak, but severe technical damage had already resulted in a lower low. Then prices rose for next three days but found resistance at the 20-day simple moving average. The following day, prices plunged, giving back all the gains that had been made in the prior three trading sessions, producing a lower high. This setup was an interesting reversal pattern known as a bearish mat hold. It is a five-day candlestick pattern where the first day begins with a long black day. The next three candlesticks are bullish white bodies, with each closing higher than its predecessor the previous day. On the fifth day, a long black candlestick emerges that closes below the open of the second day. The transports had three strikes against it, with a lower low and a lower high in place, and prices finding resistance at the 20-day simple moving average, and now a bearish candlestick pattern. Confirmation of the pattern came the following day as prices closed below the low of the pattern. Prices continued lower for two more days, until a bullish engulfing candlestick made an appearance. |
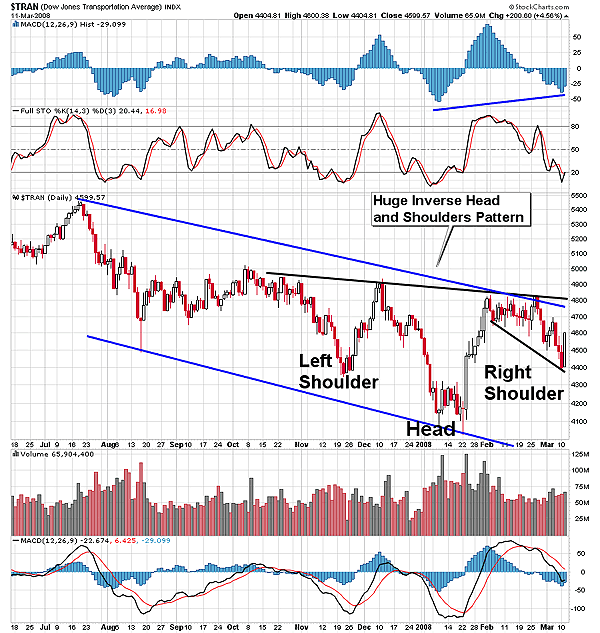
| With a reversal in place, a broadening formation was now under construction, which is right-angled and descending. The pattern looks like a backward ascending triangle. This pattern is chronicled in Thomas Bulkowski's masterpiece, Encyclopedia Of Chart Patterns. In this work, Bulkowski classifies it as a "short-term bullish continuation" pattern. If this broadening formation is acting as a continuation pattern, then three important events will take place as seen in Figure 2. First, prices will once again rise to test resistance at the 4826 level, which is the upper boundary of the pattern. Second, if that occurs, prices will break out of the long-term falling price channel that has evolved since last summer. Finally, the broadening formation may be setting up a right shoulder in a huge inverse head & shoulders pattern, which has been setting up since mid-October. This pattern could bring about a complete reversal. |

|
| FIGURE 2: DJTA, DAILY. Watch for a breakout confirmation of the broadening formation pattern and the falling price channel. A breakout of the broadening formation could set up a right shoulder on a huge inverse head & shoulders pattern. |
| Graphic provided by: StockCharts.com. |
| |
| The odds of a test to the upper part of the broadening formation are likely, given that the engulfing candlestick allowed for a higher bar to develop on the moving average convergence/divergence (MACD) histogram, confirming long-term positive divergence on that same indicator. Broadening formations, right-angled and descending, are prone to failure, so the pattern isn't a sure thing. But in scoring the pattern, Bulkowski's research showed that "patterns acting as reversals occur 143 times, and 131 act as continuations of the prevailing price trend." So there is almost a 50/50 chance here with odds at 14 to 13. |
Ron Walker is an active trader and technical analyst. He operates an educational website dedicated to the study of Technical Analysis. The website offers free market analysis with daily video presentations and written commentaries. Ron is a video pioneer, being one of the first to utilize the internet producing Technical Analysis videos. His website is thechartpatterntrader.com
| Website: | thechartpatterntrader.com |
| E-mail address: | thechartpatterntrader@gmail.com |
Click here for more information about our publications!
Comments
Date: 03/17/08Rank: 2Comment:

Request Information From Our Sponsors
- StockCharts.com, Inc.
- Candle Patterns
- Candlestick Charting Explained
- Intermarket Technical Analysis
- John Murphy on Chart Analysis
- John Murphy's Chart Pattern Recognition
- John Murphy's Market Message
- MurphyExplainsMarketAnalysis-Intermarket Analysis
- MurphyExplainsMarketAnalysis-Visual Analysis
- StockCharts.com
- Technical Analysis of the Financial Markets
- The Visual Investor
- VectorVest, Inc.
- Executive Premier Workshop
- One-Day Options Course
- OptionsPro
- Retirement Income Workshop
- Sure-Fire Trading Systems (VectorVest, Inc.)
- Trading as a Business Workshop
- VectorVest 7 EOD
- VectorVest 7 RealTime/IntraDay
- VectorVest AutoTester
- VectorVest Educational Services
- VectorVest OnLine
- VectorVest Options Analyzer
- VectorVest ProGraphics v6.0
- VectorVest ProTrader 7
- VectorVest RealTime Derby Tool
- VectorVest Simulator
- VectorVest Variator
- VectorVest Watchdog
