HOT TOPICS LIST
- MACD
- Fibonacci
- RSI
- Gann
- ADXR
- Stochastics
- Volume
- Triangles
- Futures
- Cycles
- Volatility
- ZIGZAG
- MESA
- Retracement
- Aroon
INDICATORS LIST
LIST OF TOPICS
PRINT THIS ARTICLE
by James Kupfer
In the likely event that the S&P 500 and other equity indexes continue to fall, we can calculate support levels for them based on Fibonacci levels.
Position: Sell
James Kupfer
Mr. Kupfer is a market professional and amateur stock market commentator. Disclosure: It is likely that Mr. Kupfer has or will enter a position in any security he writes about.
PRINT THIS ARTICLE
FIBONACCI
Where Will The SPY Land?
03/14/08 02:36:16 PMby James Kupfer
In the likely event that the S&P 500 and other equity indexes continue to fall, we can calculate support levels for them based on Fibonacci levels.
Position: Sell
| If the Standard & Poor's 500 and other major equity markets continue their multimonth downtrend, where are they likely to stop? We can answer this question by using Fibonacci levels, with which we can project future potential price targets for SPY and subsequently apply the same techniques to other stocks and indexes as well. |
| Traders have successfully applied the science of the Fibonacci numbers to a variety of financial markets using common Fibonacci retracement levels. The most ubiquitous of those levels are 38.2%, 50%, and 78.6%, but other lesser-utilized -- but just as important -- levels exist, such as 127.2% and 161.8%. To find support and resistance levels, I find it helpful to apply Fibonacci levels between major pivot points and look for where these levels cluster together. The more levels that converge on a price range, the stronger the support or resistance. |
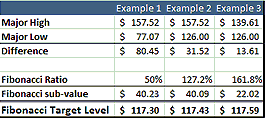
| Using the S&P 500 tracking stock, SPY, as an example, we find 50% of the difference between the SPY low in October 2002 and the SPY top in October 2007, and then subtract that difference from the SPY top to determine the support level. Many common charting packages will do the math for you, but if you do the math yourself you will see that support is at $117.30. If you calculate 127.2% of the difference from the market top in October to the January bottom and subtract that from the top you reach a price target of $117.43. The same exercise based on 161.8% of the difference from the January low to the February rebound high yields a target of $117.59. So look out around $117.50, the SPY is coming in for a landing! See Figure 1. |

|
| FIGURE 1: FIBONACCI EXAMPLES |
| Graphic provided by: Made in Excel. |
| |
Mr. Kupfer is a market professional and amateur stock market commentator. Disclosure: It is likely that Mr. Kupfer has or will enter a position in any security he writes about.
Click here for more information about our publications!
Comments
Date: 03/17/08Rank: 2Comment:

Request Information From Our Sponsors
- StockCharts.com, Inc.
- Candle Patterns
- Candlestick Charting Explained
- Intermarket Technical Analysis
- John Murphy on Chart Analysis
- John Murphy's Chart Pattern Recognition
- John Murphy's Market Message
- MurphyExplainsMarketAnalysis-Intermarket Analysis
- MurphyExplainsMarketAnalysis-Visual Analysis
- StockCharts.com
- Technical Analysis of the Financial Markets
- The Visual Investor
- VectorVest, Inc.
- Executive Premier Workshop
- One-Day Options Course
- OptionsPro
- Retirement Income Workshop
- Sure-Fire Trading Systems (VectorVest, Inc.)
- Trading as a Business Workshop
- VectorVest 7 EOD
- VectorVest 7 RealTime/IntraDay
- VectorVest AutoTester
- VectorVest Educational Services
- VectorVest OnLine
- VectorVest Options Analyzer
- VectorVest ProGraphics v6.0
- VectorVest ProTrader 7
- VectorVest RealTime Derby Tool
- VectorVest Simulator
- VectorVest Variator
- VectorVest Watchdog
