HOT TOPICS LIST
- MACD
- Fibonacci
- RSI
- Gann
- ADXR
- Stochastics
- Volume
- Triangles
- Futures
- Cycles
- Volatility
- ZIGZAG
- MESA
- Retracement
- Aroon
INDICATORS LIST
LIST OF TOPICS
PRINT THIS ARTICLE
by Alan R. Northam
Ever since 2002, Exxon's share price has been consistently moving higher and higher. Does Exxon have the energy to continue higher, or is it running out of gas?
Position: N/A
Alan R. Northam
Alan Northam lives in the Dallas, Texas area and as an electronic engineer gave him an analytical mind from which he has developed a thorough knowledge of stock market technical analysis. His abilities to analyze the future direction of the stock market has allowed him to successfully trade of his own portfolio over the last 30 years. Mr. Northam is now retired and trading the stock market full time. You can reach him at inquiry@tradersclassroom.com or by visiting his website at http://www.tradersclassroom.com. You can also follow him on Twitter @TradersClassrm.
PRINT THIS ARTICLE
DOW THEORY
Exxon Running Out Of Gas?
03/13/08 08:55:08 AMby Alan R. Northam
Ever since 2002, Exxon's share price has been consistently moving higher and higher. Does Exxon have the energy to continue higher, or is it running out of gas?
Position: N/A
| According to Dow theory, a bull market is defined as a market whereby price makes a series of higher highs and higher lows, whereas a bear market makes a series of lower price highs and lower price lows. Dow theory also states that a change in trend has been made, such as going from a bull market to a bear market, when price makes its first lower high followed by a lower low. |
| A "dead cross" occurs when a shorter-term moving average, such as the 50-day moving average, crosses below a longer-term moving average, such as a 200-day moving average. When a "dead cross" occurs, it is a sign that sentiment in the market has turned decidedly against the stock. |
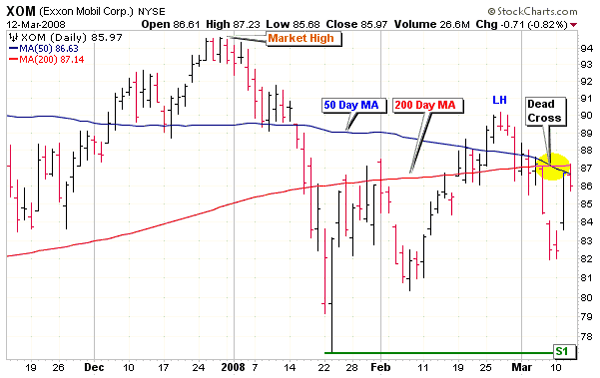
| Figure 1 shows a price chart for Exxon Mobil (XOM). As you can see, after a correction that started at the end of 2007 and ended in mid-January 2008, price rallied higher but failed to make a new price high, instead making a lower price high, marked "LH" on the price chart, in late February 2008. Since that time, price has been trading back lower but has not made a lower low as of this date. This recent market action has satisfied the first half of Dow theory tenet that a change in market direction has occurred for Exxon but has not satisfied the second half of the Dow theory requirement that the market must also make a lower low. |

|
| FIGURE 1: EXXON MOBIL, DAILY |
| Graphic provided by: StockCharts.com. |
| |
| When we turn our attention to the 50-day moving average and the 200-day moving average, we note that the 50-day moving average has recently crossed below the 200-day moving average. This crossing is identified as a dead cross and indicates that market sentiment has turned against Exxon. This further signifies that buyers are not willing to buy the market higher and sellers are out there selling the market lower. |
| In conclusion, price is now testing strong resistance of the 50-day and the 200-day moving averages from below. If the market sentiment has turned against Exxon, then the strong resistance price level of the 50-day and the 200-day moving averages should hold and Exxon should bounce off this wall of resistance and turn back down to test major support at S1, drawn off the mid-January low. A break below this support price level will satisfy the second half of the Dow theory that a trend reversal has occurred. Although it is not yet clear if Exxon will manage to break out above the 50-day and 200-day moving averages and push to make a new higher high price, in keeping the bull market for Exxon alive, it does appear that Exxon could be running out of gas. |
Alan Northam lives in the Dallas, Texas area and as an electronic engineer gave him an analytical mind from which he has developed a thorough knowledge of stock market technical analysis. His abilities to analyze the future direction of the stock market has allowed him to successfully trade of his own portfolio over the last 30 years. Mr. Northam is now retired and trading the stock market full time. You can reach him at inquiry@tradersclassroom.com or by visiting his website at http://www.tradersclassroom.com. You can also follow him on Twitter @TradersClassrm.
| Garland, Tx | |
| Website: | www.tradersclassroom.com |
| E-mail address: | inquiry@tradersclassroom.com |
Click here for more information about our publications!
PRINT THIS ARTICLE

|

Request Information From Our Sponsors
- StockCharts.com, Inc.
- Candle Patterns
- Candlestick Charting Explained
- Intermarket Technical Analysis
- John Murphy on Chart Analysis
- John Murphy's Chart Pattern Recognition
- John Murphy's Market Message
- MurphyExplainsMarketAnalysis-Intermarket Analysis
- MurphyExplainsMarketAnalysis-Visual Analysis
- StockCharts.com
- Technical Analysis of the Financial Markets
- The Visual Investor
- VectorVest, Inc.
- Executive Premier Workshop
- One-Day Options Course
- OptionsPro
- Retirement Income Workshop
- Sure-Fire Trading Systems (VectorVest, Inc.)
- Trading as a Business Workshop
- VectorVest 7 EOD
- VectorVest 7 RealTime/IntraDay
- VectorVest AutoTester
- VectorVest Educational Services
- VectorVest OnLine
- VectorVest Options Analyzer
- VectorVest ProGraphics v6.0
- VectorVest ProTrader 7
- VectorVest RealTime Derby Tool
- VectorVest Simulator
- VectorVest Variator
- VectorVest Watchdog
