HOT TOPICS LIST
- MACD
- Fibonacci
- RSI
- Gann
- ADXR
- Stochastics
- Volume
- Triangles
- Futures
- Cycles
- Volatility
- ZIGZAG
- MESA
- Retracement
- Aroon
INDICATORS LIST
LIST OF TOPICS
PRINT THIS ARTICLE
by Ron Walker
The Aroon recently flashed a bearish signal. Could we be headed for a bear market?
Position: N/A
Ron Walker
Ron Walker is an active trader and technical analyst. He operates an educational website dedicated to the study of Technical Analysis. The website offers free market analysis with daily video presentations and written commentaries. Ron is a video pioneer, being one of the first to utilize the internet producing Technical Analysis videos. His website is thechartpatterntrader.com
PRINT THIS ARTICLE
The Aroon : A Case For The Bears
03/14/08 10:01:42 AMby Ron Walker
The Aroon recently flashed a bearish signal. Could we be headed for a bear market?
Position: N/A
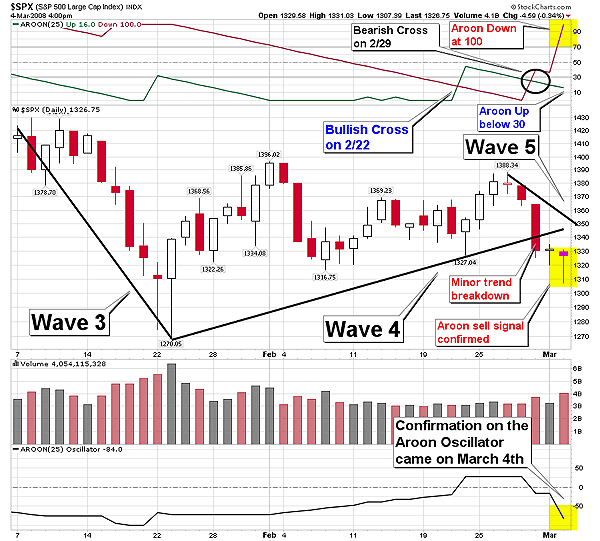
| The Aroon is a trend-based indicator that is plotted horizontally on a vertical scale from zero to 100. There is an Aroon up line and an Aroon down line. When the trend is bearish, the Aroon down line (a bearish indicator) moves above the value of 70, signaling a strong down trend, while the Aroon up line (bullish indicator) has a movement below 30. And that is exactly what occurred on the daily Standard & Poor's 500 chart in Figure 1. On February 29, the minor price trend was violated while simultaneously the Aroon down crossed above the Aroon up (a bearish signal), but it remain below the value of 70. Two trading sessions later, the Aroon down moved above the value of 70 to 100. The Aroon's behavior signaled that a strong downtrend was under way, which suggests that the S&P 500 has begun the next leg down, which is likely the Elliott wave 5. In Figure 1, the S&P 500 pushed lower, producing four Elliott waves from the October 11th high until the minor peak that was made on February 27 at 1388. |

|
| FIGURE 1, S&P 500, DAILY. The trend breakdown on the price chart on February 29 corresponds with the Aroon down moving above Aroon up, signaling a bearish crossover. Two trading sessions later, on March 4, Aroon down rose above 70, signaling a strong downtrend to come. That signal was confirmed by the Aroon oscillator.The bullish cross, which came on February 22 on the Aroon up, never got a follow-through during the minor trend that developed over January and February; nor did it move above the value of +50. The move quickly reversed as the Aroon down crossed above it on February 29. |
| Graphic provided by: TradeStation. |
| |
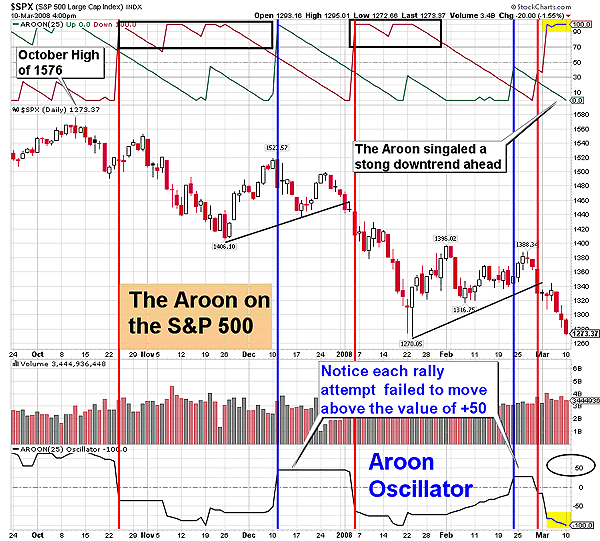
| In Figure 2, the S&P 500 generated three sell signals from the October highs, one buy signal, and one false buy signal given by the Aroon. The blue and red lines mark each candlestick, the day the buy/sell signal occurred. The two buy signals (marked with blue lines on Figure 2) were given each time the S&P 500 was in a contratrend. The first buy signal in December had confirmation as Aroon up catapulted above 70, but the second buy signal in February 22 was false. This was because the Aroon up failed to confirm the crossover by not rising above the value of 50. The move quickly reversed as the Aroon down crossed above it on February 29. Shortly after the minor trends were starting to develop, they were quickly violated in December and February as the prior trend reemerged. The Aroon flashed a sell signal immediately after both of the minor trends brokedown. The three sell signals (marked with red lines on Figure 2) that were given all received confirmation as the Aroon down rose to extreme levels above 70. The first sell signal was given in the early stages of the downtrend, while the latter two signals were very timely, coinciding around the time of the breakdown of each of the minor trends. |

|
| FIGURE 2, S&P 500, DAILY. The S&P 500 generated three sell signals from the October highs, one buy signal, and one false buy signal given by the Aroon. The two buy signals were given each time that the market was in a contratrend. In both December and February as the minor trends developed they were quickly violated as the prior trend reemerged. The minor trend that developed off the January low was never confirmed by the Aroon. A false buy signal was produced because the Aroon up did not move above the value of 50. |
| Graphic provided by: StockCharts.com. |
| |
| The Aroon oscillator works well with the Aroon. When the oscillator moves above +50, it indicates the early stages of a new trend. When it hovers near the zero line, prices are trendless. If the oscillator breaks below the value of -50, it signals that a bearish trend is developing. Note in Figure 2, how each rally attempt failed to move above the value of +50. The Aroon oscillator presented a short opportunity when it moved below the value of - 50, shortly after each of the contratrends failed, as prices broke the minor trendlines. |
Ron Walker is an active trader and technical analyst. He operates an educational website dedicated to the study of Technical Analysis. The website offers free market analysis with daily video presentations and written commentaries. Ron is a video pioneer, being one of the first to utilize the internet producing Technical Analysis videos. His website is thechartpatterntrader.com
| Website: | thechartpatterntrader.com |
| E-mail address: | thechartpatterntrader@gmail.com |
Click here for more information about our publications!
Comments
Date: 03/17/08Rank: 1Comment:
Date: 03/18/08Rank: 5Comment:
Date: 04/12/08Rank: 4Comment:

Request Information From Our Sponsors
- StockCharts.com, Inc.
- Candle Patterns
- Candlestick Charting Explained
- Intermarket Technical Analysis
- John Murphy on Chart Analysis
- John Murphy's Chart Pattern Recognition
- John Murphy's Market Message
- MurphyExplainsMarketAnalysis-Intermarket Analysis
- MurphyExplainsMarketAnalysis-Visual Analysis
- StockCharts.com
- Technical Analysis of the Financial Markets
- The Visual Investor
- VectorVest, Inc.
- Executive Premier Workshop
- One-Day Options Course
- OptionsPro
- Retirement Income Workshop
- Sure-Fire Trading Systems (VectorVest, Inc.)
- Trading as a Business Workshop
- VectorVest 7 EOD
- VectorVest 7 RealTime/IntraDay
- VectorVest AutoTester
- VectorVest Educational Services
- VectorVest OnLine
- VectorVest Options Analyzer
- VectorVest ProGraphics v6.0
- VectorVest ProTrader 7
- VectorVest RealTime Derby Tool
- VectorVest Simulator
- VectorVest Variator
- VectorVest Watchdog
