HOT TOPICS LIST
- MACD
- Fibonacci
- RSI
- Gann
- ADXR
- Stochastics
- Volume
- Triangles
- Futures
- Cycles
- Volatility
- ZIGZAG
- MESA
- Retracement
- Aroon
INDICATORS LIST
LIST OF TOPICS
PRINT THIS ARTICLE
by Chaitali Mohile
Present correction in the French CAC 40 Index is the combination of global uncertainty and two major breakouts on technical charts.
Position: N/A
Chaitali Mohile
Active trader in the Indian stock markets since 2003 and a full-time writer. Trading is largely based upon technical analysis.
PRINT THIS ARTICLE
BREAKOUTS
France Index Had Two Major Breaks
03/25/08 11:07:33 AMby Chaitali Mohile
Present correction in the French CAC 40 Index is the combination of global uncertainty and two major breakouts on technical charts.
Position: N/A
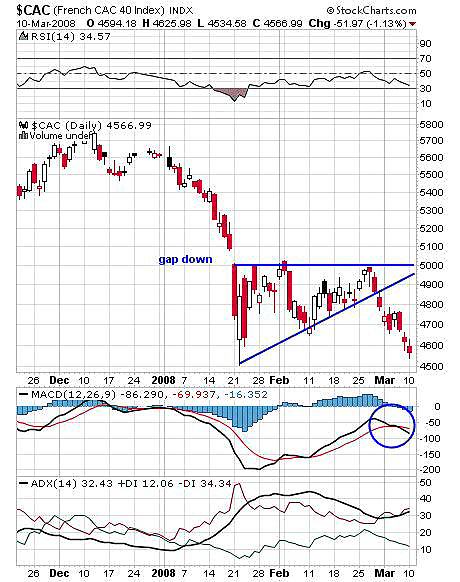
| An ascending triangle can be a reversal pattern at the end of the downtrend but it is typically a continuation pattern. The pattern breaks upward, being a bullish continuation pattern in an uptrend or reversal pattern in downtrend. So if the pattern fails to follow the rule and drifts in the opposite direction, a serious bearish tide floods in (Figure 1). The French CAC 40 Index is therefore under a flood watch. The index is in a deep downtrend since the beginning of 2008. The gap down in mid-January boosted the bears, finally capturing the trend after a long battle. The index then entered a consolidation period indicating the end to the downtrend and formed an ascending triangle. As mentioned, the pattern is seen as a reversal signal. But it failed as the index was pulled down in favor of bears and fresh selling pressure was seen. |

|
| FIGURE 1: $CAC, DAILY. The index has been in a deep downtrend since the beginning of 2008. |
| Graphic provided by: StockCharts.com. |
| |
| The pattern failure was robust and plunged the index further about 350 points. The relative strength index (RSI) (14) has room left below to hit an oversold area. Meanwhile, the possibility of a corrective phase to sustain is wide. In addition, the moving average convergence/divergence (MACD) (12,26,9) has a bearish crossover in negative territory and the downtrend is intact. So the pattern failure here can lead to a bloodbath. |

|
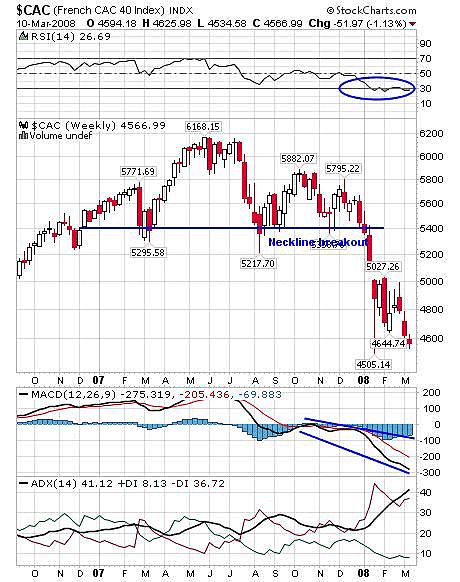
| FIGURE 2: $CAC, WEEKLY. The MACD has a bearish crossover in negative territory and the downtrend is intact. |
| Graphic provided by: StockCharts.com. |
| |
| Figure 2 has an important reversal pattern, a head & shoulders top. As the name suggests, the pattern appears at the top in the uptrend and warns the bulls. The pattern shows the slowdown in bulls as the neckline is turned to resistance. In Figure 2, the neckline appears at the 5400 level and the crossover cracked the index almost 768 points since early 2008. This proves how reliable and strong the pattern is. The pattern was completed almost after one year, giving many trading opportunities. The volumes do fluctuate, as the pattern is formed, gradually increasing the sellers. |
| The target on the head & shoulders top is measured by calculating the distance between the head and the neckline from the right side. The distance is 6168 (head) - 5400 (neckline) = 768. So if you subtract 768 from 5400 you get 4632, which is the approximate downside target. And according to Figure 2, $CAC is close to this level. The low made in recent weeks is 4644, whereas the lowest level is 4505 (made by long lower shadow). The RSI (14) is in oversold territory for the last two months. The MACD (12,26,9) is in negative territory, reflecting the bearish mood, and the trend continues to be down. $CAC still has bears hover around, and thus can easily achieve the target and may test the lowest support as well. |
| To conclude, the ascending triangle breaking down and the head & shoulders top breaking out forecasts the storm ahead. |
Active trader in the Indian stock markets since 2003 and a full-time writer. Trading is largely based upon technical analysis.
| Company: | Independent |
| Address: | C1/3 Parth Indraprasth Towers. Vastrapur |
| Ahmedabad, Guj 380015 | |
| E-mail address: | chaitalimohile@yahoo.co.in |
Traders' Resource Links | |
| Independent has not added any product or service information to TRADERS' RESOURCE. | |
Click here for more information about our publications!
Comments
Date: 03/27/08Rank: 5Comment:

Request Information From Our Sponsors
- StockCharts.com, Inc.
- Candle Patterns
- Candlestick Charting Explained
- Intermarket Technical Analysis
- John Murphy on Chart Analysis
- John Murphy's Chart Pattern Recognition
- John Murphy's Market Message
- MurphyExplainsMarketAnalysis-Intermarket Analysis
- MurphyExplainsMarketAnalysis-Visual Analysis
- StockCharts.com
- Technical Analysis of the Financial Markets
- The Visual Investor
- VectorVest, Inc.
- Executive Premier Workshop
- One-Day Options Course
- OptionsPro
- Retirement Income Workshop
- Sure-Fire Trading Systems (VectorVest, Inc.)
- Trading as a Business Workshop
- VectorVest 7 EOD
- VectorVest 7 RealTime/IntraDay
- VectorVest AutoTester
- VectorVest Educational Services
- VectorVest OnLine
- VectorVest Options Analyzer
- VectorVest ProGraphics v6.0
- VectorVest ProTrader 7
- VectorVest RealTime Derby Tool
- VectorVest Simulator
- VectorVest Variator
- VectorVest Watchdog
