HOT TOPICS LIST
- MACD
- Fibonacci
- RSI
- Gann
- ADXR
- Stochastics
- Volume
- Triangles
- Futures
- Cycles
- Volatility
- ZIGZAG
- MESA
- Retracement
- Aroon
INDICATORS LIST
LIST OF TOPICS
PRINT THIS ARTICLE
by David Penn
What do you do when a stock is caught between an intermediate rally failure and a sustaining long-term bull trend?
Position: N/A
David Penn
Technical Writer for Technical Analysis of STOCKS & COMMODITIES magazine, Working-Money.com, and Traders.com Advantage.
PRINT THIS ARTICLE
TECHNICAL ANALYSIS
Merck: Trends in Trends
03/27/01 09:06:41 AMby David Penn
What do you do when a stock is caught between an intermediate rally failure and a sustaining long-term bull trend?
Position: N/A
| Long-term trends are like Russian dolls: inside of each one is a smaller version of the outer one. Just as a blonde Russian doll might open up to contain a rose-cheeked redheaded doll (which might in turn open up to contain still yet another, smaller doll of different design), so do long-term trends in the market contain smaller, intermediate trends. Within those trends are smaller trends still: short-term trends begetting weekly and daily trends begetting intra-day swings ... |
| Studying the different internal rallies and corrections that make up long-term trends can help evaluate the possible sustainability of the long-term trend. Given that no stock ever moves straight up, but instead advances, retraces and (hopefully) advances again, it is often wise to be cautious upon discovering an advancing stock that has had few corrections (or declines). Often, advancing stocks that enter into consolidation ranges are thought to be worth watching for upside breakouts. Unfortunately, when consolidation ranges occur at the tops of advancing stocks, they are often distribution periods during which those who have benefitted from the stock's advance sell to those hoping the advance has not yet finished. |

|
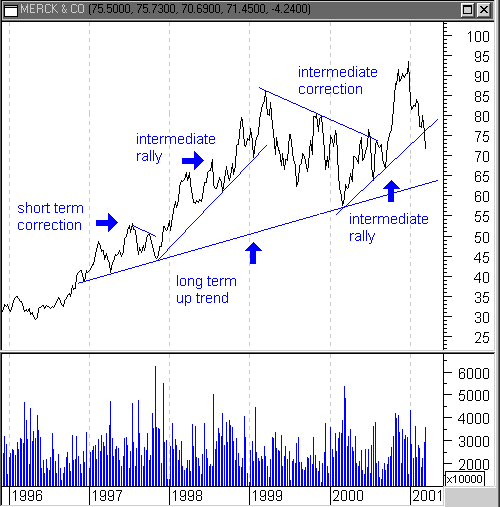
| Merck's four-year uptrend is, like most long-term trends, made up of a number of smaller, intermediate trends, rallies and corrections. |
| Graphic provided by: MetaStock. |
| |
| On the other hand, keeping track of how often and how severely a stock corrects its advance over time can make it easier to evaluate whether a particular correction represents an opportunity to buy a previously advancing stock, or is the first leg of a reversal. |
| One market truism suggests buying declines approaching an upward trendline. This assumes the decline is subordinate to the trend on which the line is based. In the case of Merck [MRK], the intermediate correction from the spring 1999 high to the summer of 2000 lasted for 16 months, but it occurred in the context of an up trend that has been in place for Merck since late 1996 (a somewhat less bullish trend line would extend as far back as 1994). Thus, unless the opinion of Merck was that a top had been reached in the spring of 1999, the downturn would have been best viewed just as it turned out to be: an intermediate correction or minor bull market (at its lowest point in the correction, early 2000, Merck was almost 30% off its high). |
| The current chart of Merck also hints that corrections can help advancing stocks sustain their advance, in a sense letting some steam out after all the buying pressure has propelled the stock upward, often to new highs (this, of course, is one of the reasons why they're called "corrections"). While the spring 1999-summer 2000 Merck correction took a significant amount of value out of the stock, the subsequent rally in the second half of 2000 set a new high. Interestingly, even as Merck in 2001 drops beneath the trendline of that intermediate rally, the long term uptrend for Merck remains very much intact. As far as the long term bull trendline goes, Merck could fall into the high to mid-60s without violating its four-year bullish bias. |
Technical Writer for Technical Analysis of STOCKS & COMMODITIES magazine, Working-Money.com, and Traders.com Advantage.
| Title: | Technical Writer |
| Company: | Technical Analysis, Inc. |
| Address: | 4757 California Avenue SW |
| Seattle, WA 98116 | |
| Phone # for sales: | 206 938 0570 |
| Fax: | 206 938 1307 |
| Website: | www.Traders.com |
| E-mail address: | DPenn@traders.com |
Traders' Resource Links | |
| Charting the Stock Market: The Wyckoff Method -- Books | |
| Working-Money.com -- Online Trading Services | |
| Traders.com Advantage -- Online Trading Services | |
| Technical Analysis of Stocks & Commodities -- Publications and Newsletters | |
| Working Money, at Working-Money.com -- Publications and Newsletters | |
| Traders.com Advantage -- Publications and Newsletters | |
| Professional Traders Starter Kit -- Software | |
Click here for more information about our publications!
Comments

Request Information From Our Sponsors
- StockCharts.com, Inc.
- Candle Patterns
- Candlestick Charting Explained
- Intermarket Technical Analysis
- John Murphy on Chart Analysis
- John Murphy's Chart Pattern Recognition
- John Murphy's Market Message
- MurphyExplainsMarketAnalysis-Intermarket Analysis
- MurphyExplainsMarketAnalysis-Visual Analysis
- StockCharts.com
- Technical Analysis of the Financial Markets
- The Visual Investor
- VectorVest, Inc.
- Executive Premier Workshop
- One-Day Options Course
- OptionsPro
- Retirement Income Workshop
- Sure-Fire Trading Systems (VectorVest, Inc.)
- Trading as a Business Workshop
- VectorVest 7 EOD
- VectorVest 7 RealTime/IntraDay
- VectorVest AutoTester
- VectorVest Educational Services
- VectorVest OnLine
- VectorVest Options Analyzer
- VectorVest ProGraphics v6.0
- VectorVest ProTrader 7
- VectorVest RealTime Derby Tool
- VectorVest Simulator
- VectorVest Variator
- VectorVest Watchdog
