HOT TOPICS LIST
- MACD
- Fibonacci
- RSI
- Gann
- ADXR
- Stochastics
- Volume
- Triangles
- Futures
- Cycles
- Volatility
- ZIGZAG
- MESA
- Retracement
- Aroon
INDICATORS LIST
LIST OF TOPICS
PRINT THIS ARTICLE
by Mike Carr, CMT
After a nearly 50% rise in only five weeks, XME is either consolidating gains or breaking down.
Position: N/A
Mike Carr, CMT
Mike Carr, CMT, is a member of the Market Technicians Association, and editor of the MTA's newsletter, Technically Speaking. He is also the author of "Smarter Investing in Any Economy: The Definitive Guide to Relative Strength Investing," and "Conquering the Divide: How to Use Economic Indicators to Catch Stock Market Trends."
PRINT THIS ARTICLE
STRATEGIES
XME: Long Or Short? Let The Market Decide
03/11/08 12:02:01 PMby Mike Carr, CMT
After a nearly 50% rise in only five weeks, XME is either consolidating gains or breaking down.
Position: N/A
| Sometimes technical analysis fails to give clear signals. But that doesn't diminish the value of analysis, since these neutral charts can provide action levels where traders are alerted to incredible opportunities after prices break out. An exchange traded fund (ETF) that tracks the SPDR S&P Metals & Mining Select Industry Index (XME) is at an indecisive price level but deserves a place on every trader's watchlist. |
| XME holds steel companies, copper miners, and coal companies. An argument can be made that it is an inflation hedge and that it stands to prosper in a recovering economy. Since no one knows if either of those macro-economic trends will occur, the charts offer the best insight into the future direction of XME. |
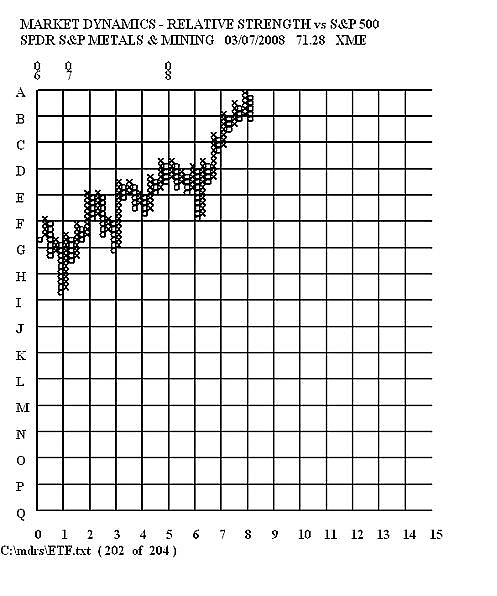
| The bullish case can be based, in part, upon the long-term point & figure chart of relative strength (Figure 1). We see that the dramatic up move has been steady from a relative strength perspective. The long-term trend is sustainable and far from overextended. In recent weeks, it has entered a consolidation and is holding on a buy signal. Momentum indicators are overbought, but have not given conclusive sell signals on weekly charts. |

|
| FIGURE 1: RELATIVE STRENGTH, VIEWED AS A POINT & FIGURE CHART. It's bullish. |
| Graphic provided by: Market Dynamics. |
| |
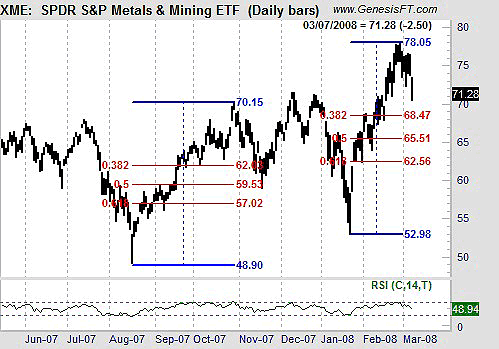
| The daily chart (Figure 2) initially looks bearish. Most indicators are on sell signals, while the relative strength index (RSI) is holding bullish levels. The chart does offer a clear support level that indicates where action should be taken. Fibonacci retracement levels have worked in the past for XME. That makes 68.47 the price from which to trade. A break below that indicates a short with a protective stop of 70 based upon the double top that formed in December. A bounce from that level offers a buy signal. Buying at 70 allows for a stop under 68.50. |

|
| FIGURE 2: XME, DAILY. This chart, neither bullish nor bearish, allows traders to enter stop orders to enter a trade based on market action. |
| Graphic provided by: Trade Navigator. |
| |
| While many traders seek clear signals from charts, XME offers a chance to use a chart to set signals for later. This type of analysis can be invaluable to the trader who likes doing their homework the night before, while markets are closed and heads are clear. |
Mike Carr, CMT, is a member of the Market Technicians Association, and editor of the MTA's newsletter, Technically Speaking. He is also the author of "Smarter Investing in Any Economy: The Definitive Guide to Relative Strength Investing," and "Conquering the Divide: How to Use Economic Indicators to Catch Stock Market Trends."
| Website: | www.moneynews.com/blogs/MichaelCarr/id-73 |
| E-mail address: | marketstrategist@gmail.com |
Click here for more information about our publications!
Comments
Date: 03/12/08Rank: 5Comment:

Request Information From Our Sponsors
- VectorVest, Inc.
- Executive Premier Workshop
- One-Day Options Course
- OptionsPro
- Retirement Income Workshop
- Sure-Fire Trading Systems (VectorVest, Inc.)
- Trading as a Business Workshop
- VectorVest 7 EOD
- VectorVest 7 RealTime/IntraDay
- VectorVest AutoTester
- VectorVest Educational Services
- VectorVest OnLine
- VectorVest Options Analyzer
- VectorVest ProGraphics v6.0
- VectorVest ProTrader 7
- VectorVest RealTime Derby Tool
- VectorVest Simulator
- VectorVest Variator
- VectorVest Watchdog
- StockCharts.com, Inc.
- Candle Patterns
- Candlestick Charting Explained
- Intermarket Technical Analysis
- John Murphy on Chart Analysis
- John Murphy's Chart Pattern Recognition
- John Murphy's Market Message
- MurphyExplainsMarketAnalysis-Intermarket Analysis
- MurphyExplainsMarketAnalysis-Visual Analysis
- StockCharts.com
- Technical Analysis of the Financial Markets
- The Visual Investor
