HOT TOPICS LIST
- MACD
- Fibonacci
- RSI
- Gann
- ADXR
- Stochastics
- Volume
- Triangles
- Futures
- Cycles
- Volatility
- ZIGZAG
- MESA
- Retracement
- Aroon
INDICATORS LIST
LIST OF TOPICS
PRINT THIS ARTICLE
by Chaitali Mohile
A number of factors in candlesticks help identify the strength of the present or forthcoming rally.
Position: N/A
Chaitali Mohile
Active trader in the Indian stock markets since 2003 and a full-time writer. Trading is largely based upon technical analysis.
PRINT THIS ARTICLE
CANDLESTICK CHARTING
Candlesticks Show Strength In The Sterling
03/20/08 09:28:40 AMby Chaitali Mohile
A number of factors in candlesticks help identify the strength of the present or forthcoming rally.
Position: N/A
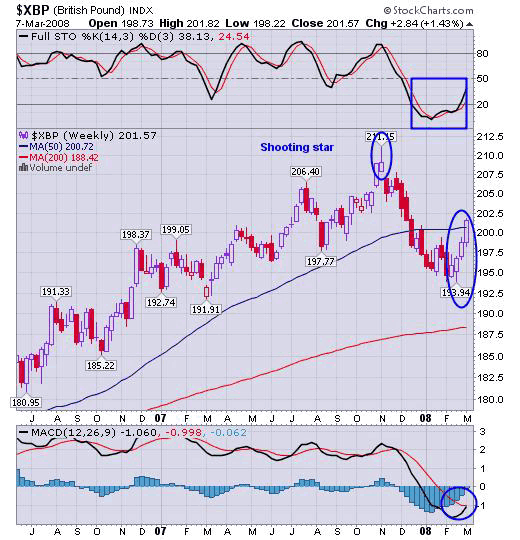
| On the weekly chart in Figure 1, the first marked circle at the highest level shows a shooting star, which is a bearish reversal pattern. The long upper shadow suggests the weakness in holding at the high of the day. The shooting star is a single line candle and therefore is not the strongest indication but it cannot be ignored. When a lack of strength appears at new highs there is a strong chance that the rally is likely to take a U-turn. In this chart, if we combine the shooting star and the overbought stochastic (14,3,3) at 80, which took a nosedive three times from the same level, then a confirming reversal signal is observed. Thereon, the British pound ($XBP) witnessed bad days in coming weeks, violating the strong supports. The moving average convergence/divergence (MACD) (12,26,9) moved into negative territory till a slowdown in the declining rally. |

|
| FIGURE 1: $XBP, WEEKLY. Three rising bullish candles show the increasing strength in a rally, supported by bullish indicators. |
| Graphic provided by: StockCharts.com. |
| |
| Volatility was at its high till the index consolidated below the resistance line. The second marked circle (see Figure 1) shows three white candles, which we cannot claim as three white soldiers or an advance block. For three white soldiers there must be three strong full bullish candles with smaller or no shadows. Here, the second and third candles have comparatively long shadows. These shadows suggest the rally is stalling. But the three candles show upcoming strength as the index moves closer to the resistance line. The first candle with a lower shadow formed a base at the low at 193.94. The next candle had a smaller shadow and the third complete bullish candle had a much smaller shadow than the previous candles. |
| By looking at the price chart you can understand the strength in the rally. Here, for more confirmation, the stochastic (14,3,3) has surged from an oversold area, trying to hit the bullish level of 50. In addition, the MACD (12,26,9) is in the mood to tune in a bullish crossover. The third bullish candle has also closed above the 50 MA, so the rally establishing support here would be robust. |

|
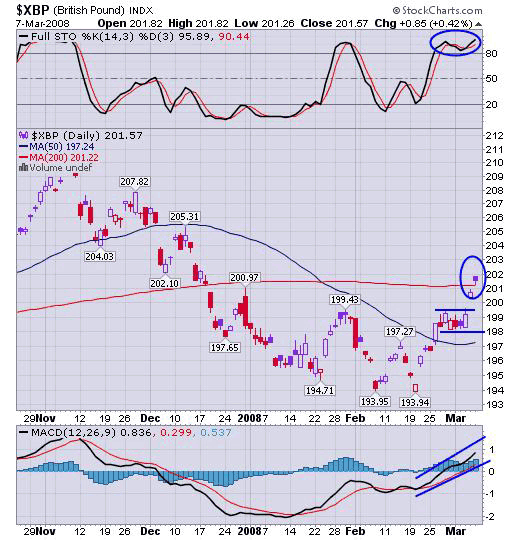
| FIGURE 2: $XBP, DAILY. The hanging man stands with the support of a 200-day moving average, essential to begin a fresh rally ahead. The MACD (12,26,9) moving in positive territory can bring in some bullish activity. |
| Graphic provided by: StockCharts.com. |
| |
| On the daily chart seen in Figure 2, the hanging man support is very important for a stable advance breakout. The consolidation broke out with two consecutive gaps up, taking off the 200-day MA resistance. The candle that is appearing on the newly converted support is a hanging man bearish reversal pattern. This candlestick pattern appears after a significant advance rally and is also seen as a strong reversal signal. Although the hanging man is on a bullish path, the support established is equally strong. The weekly chart shows a strong rally in the near future, but the hanging man with a highly overbought stochastic (14,3,3) may be jittery. So establishing support over a 50-day MA is essential to maintain the strength of the rally. |
| Thus, the candlestick pattern can serve as a clean roadmap for the next move. |
Active trader in the Indian stock markets since 2003 and a full-time writer. Trading is largely based upon technical analysis.
| Company: | Independent |
| Address: | C1/3 Parth Indraprasth Towers. Vastrapur |
| Ahmedabad, Guj 380015 | |
| E-mail address: | chaitalimohile@yahoo.co.in |
Traders' Resource Links | |
| Independent has not added any product or service information to TRADERS' RESOURCE. | |
Click here for more information about our publications!
Comments
Date: 03/22/08Rank: 3Comment:

Request Information From Our Sponsors
- StockCharts.com, Inc.
- Candle Patterns
- Candlestick Charting Explained
- Intermarket Technical Analysis
- John Murphy on Chart Analysis
- John Murphy's Chart Pattern Recognition
- John Murphy's Market Message
- MurphyExplainsMarketAnalysis-Intermarket Analysis
- MurphyExplainsMarketAnalysis-Visual Analysis
- StockCharts.com
- Technical Analysis of the Financial Markets
- The Visual Investor
- VectorVest, Inc.
- Executive Premier Workshop
- One-Day Options Course
- OptionsPro
- Retirement Income Workshop
- Sure-Fire Trading Systems (VectorVest, Inc.)
- Trading as a Business Workshop
- VectorVest 7 EOD
- VectorVest 7 RealTime/IntraDay
- VectorVest AutoTester
- VectorVest Educational Services
- VectorVest OnLine
- VectorVest Options Analyzer
- VectorVest ProGraphics v6.0
- VectorVest ProTrader 7
- VectorVest RealTime Derby Tool
- VectorVest Simulator
- VectorVest Variator
- VectorVest Watchdog
