HOT TOPICS LIST
- MACD
- Fibonacci
- RSI
- Gann
- ADXR
- Stochastics
- Volume
- Triangles
- Futures
- Cycles
- Volatility
- ZIGZAG
- MESA
- Retracement
- Aroon
INDICATORS LIST
LIST OF TOPICS
PRINT THIS ARTICLE
by Chaitali Mohile
A bullish flag & pennant pattern failed as MBFI dropped toward its low pivot. If a double bottom is formed, could the stock witness a relief rally?
Position: Buy
Chaitali Mohile
Active trader in the Indian stock markets since 2003 and a full-time writer. Trading is largely based upon technical analysis.
PRINT THIS ARTICLE
CHART ANALYSIS
Could MB Financial Undergo A Pullback?
03/20/08 08:44:57 AMby Chaitali Mohile
A bullish flag & pennant pattern failed as MBFI dropped toward its low pivot. If a double bottom is formed, could the stock witness a relief rally?
Position: Buy
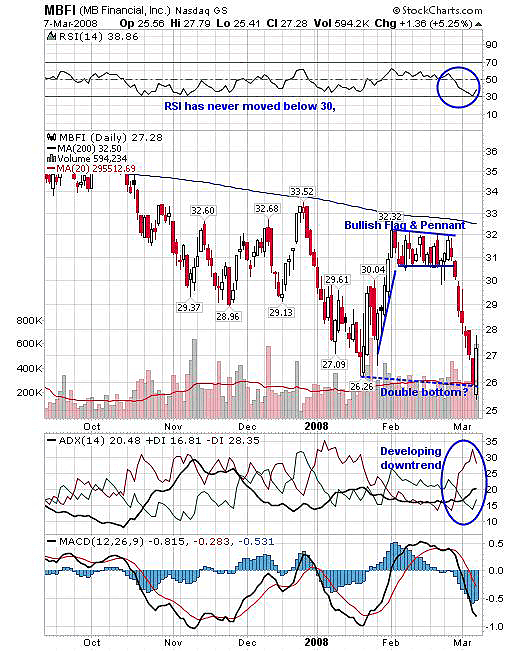
| MB Financial (MBFI) is highly volatile and the stock is unable to sustain a trend due to equal pressure from buyers and sellers. The scenario in Figure 1 shows that MB Financial is likely to enter a new downtrend (for the time being) as selling pressure has increased with the breakdown from the major bullish continuation pattern, that is, the flag & pennant pattern. Under the resistance of the 200-day moving average, the security gave various buying and selling opportunities for diehard traders by trading between the ranges. The relative strength index (RSI) (14) would give better judgment of the situation and trading. The indicator has not moved below 30, indicating limited bearish strength, but nor has it surged to highly overbought areas above 70. So even the bulls had limited space to try their hands due to upper resistance. |

|
| FIGURE 1: MBFI, DAILY. MB Financial entered a new downtrend with a failure of a bullish flag & pennant breakout. The downside move is likely to form a double bottom that can initiate a fresh upward rally. |
| Graphic provided by: StockCharts.com. |
| |
| However, the bullish flag & pennant formation raised hopes of crossing above the resistance of the 200-day MA and reaching previous highs. The bullish flag appears while the stock consolidates after an advance rally. Normally you would expect the breakout to be upward, a continuation of the previous rally. But as you can see, prices went in the opposite direction, lowering any hopes of a bullish strength. Figure 1 shows that a similar breakout that boosted the bearish power diluted bullish hopes. As a result, the pattern failure opened up opportunities for short positions with a minimum target of a low pivot. The previous low is the lowest level that MBFI has seen in the last six months. The downward move has now reached its target, indicating the possibility of a double-bottom formation. |
| A double-bottom formation is a bullish reversal pattern, formed by two distinctive points at approximately similar lows with a minimum time gap of four weeks in between. This formation gives birth to a fresh upside rally from the lower levels -- here, 26. The RSI (14) is back to the 30 level and looks like it may be ready to begin its upward journey, thus reconfirming the bullish reversal pattern and the possibility of a fresh rally towards resistance. The trading session of March 7, 2008 formed a long bullish candle that engulfed a previous bearish candle. This bullish engulfing pattern as well as an upward moving RSI could present a good buying opportunity. The moving average convergence/divergence (MACD) (12,26,9) is still showing weakness, so I would keep a close watch on any change in this indicator. |
| Traders could very well opt for a long position with a first target of a 200-day MA resistance. |
Active trader in the Indian stock markets since 2003 and a full-time writer. Trading is largely based upon technical analysis.
| Company: | Independent |
| Address: | C1/3 Parth Indraprasth Towers. Vastrapur |
| Ahmedabad, Guj 380015 | |
| E-mail address: | chaitalimohile@yahoo.co.in |
Traders' Resource Links | |
| Independent has not added any product or service information to TRADERS' RESOURCE. | |
Click here for more information about our publications!
Comments
Date: 03/22/08Rank: 4Comment:

Request Information From Our Sponsors
- StockCharts.com, Inc.
- Candle Patterns
- Candlestick Charting Explained
- Intermarket Technical Analysis
- John Murphy on Chart Analysis
- John Murphy's Chart Pattern Recognition
- John Murphy's Market Message
- MurphyExplainsMarketAnalysis-Intermarket Analysis
- MurphyExplainsMarketAnalysis-Visual Analysis
- StockCharts.com
- Technical Analysis of the Financial Markets
- The Visual Investor
- VectorVest, Inc.
- Executive Premier Workshop
- One-Day Options Course
- OptionsPro
- Retirement Income Workshop
- Sure-Fire Trading Systems (VectorVest, Inc.)
- Trading as a Business Workshop
- VectorVest 7 EOD
- VectorVest 7 RealTime/IntraDay
- VectorVest AutoTester
- VectorVest Educational Services
- VectorVest OnLine
- VectorVest Options Analyzer
- VectorVest ProGraphics v6.0
- VectorVest ProTrader 7
- VectorVest RealTime Derby Tool
- VectorVest Simulator
- VectorVest Variator
- VectorVest Watchdog
