HOT TOPICS LIST
- MACD
- Fibonacci
- RSI
- Gann
- ADXR
- Stochastics
- Volume
- Triangles
- Futures
- Cycles
- Volatility
- ZIGZAG
- MESA
- Retracement
- Aroon
INDICATORS LIST
LIST OF TOPICS
PRINT THIS ARTICLE
by Chaitali Mohile
The Philadelphia Bank Index failed to sustain the consolidation range and the strong support as well, with the correction from this area leading to retesting previous lows. Will the correction continue?
Position: N/A
Chaitali Mohile
Active trader in the Indian stock markets since 2003 and a full-time writer. Trading is largely based upon technical analysis.
PRINT THIS ARTICLE
BULL/BEAR MARKET
Bank Index Still In Correction Mood?
03/12/08 01:28:15 PMby Chaitali Mohile
The Philadelphia Bank Index failed to sustain the consolidation range and the strong support as well, with the correction from this area leading to retesting previous lows. Will the correction continue?
Position: N/A
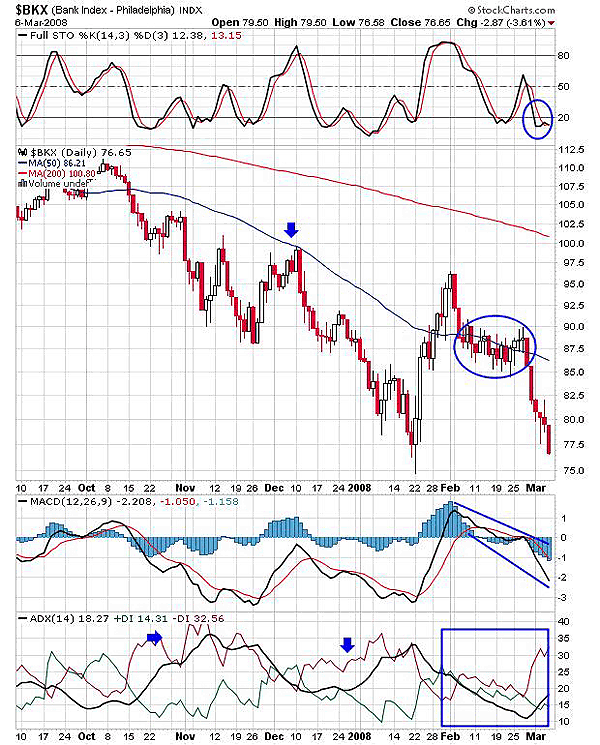
| As the average directional movement index (ADX) (14) in Figure 1 shows, the Philadelphia Bank Index ($BKX) was in a strong downtrend, pulling the price lower and lower. Even the recovery rally failed to surge above the moving average resistance. Earlier, the downtrend was well maintained by ADX (14) sustaining above 20, even after its declining rally from 35. But since late January 2008 the positive and negative directional index had a tug of war, resulting in a consolidation, and the downtrend turned weak. The price therefore consolidated in the range of 85-90 in the support/resistance area of the 50-day moving average. Just talking technically, the same resistance kept $BKX away from any recovery rally, dragging the index lower and forming new lows on every retest. So the consolidation in this area with oversold stochastic (14,3,3) gave an optimistic view to the Bank Index. |

|
| FIGURE 1: $BKX, DAILY. This chart shows how the Philadelphia Bank Index plunged on violating the 50-day moving average support. |
| Graphic provided by: StockCharts.com. |
| |
| The stochastic (14,3,3) rallied higher from the oversold area but took a nose-dive to below 30 after going above the 50 level. The price too slipped below the consolidation range, and fresh correction was initiated. The correction was hard to hold back as volatility in the global market continued. The $BKX, after a week's correction, is closer to its potential support of 75 (spikes by previous candles). This brings up the question of whether the correction still has some room left or the index may consolidate with the potential support. The moving average convergence/divergence (MACD) (12,26,9) is still weak, and the ADX (14) has moved above 15 with selling pressure. If the ADX (14) again moves above 20 the bears would spread the hands to capture the trend, but the present levels suggest consolidation at lower support. |
| The banking sector in India is troublesome. The volumes are pathetic in this sector and even in the overall Indian financial market. So building up positive sentiment on this sector for the short-term will be difficult. $BKX may take some time to bring back an optimistic view and rally higher. |

|
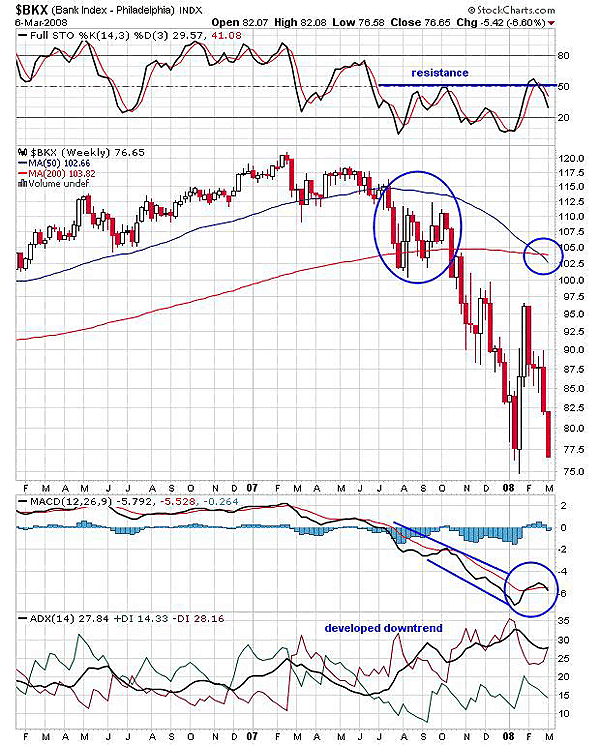
| FIGURE 2: $BKX, WEEKLY. The indicators are still weak and the downtrend is very well developed. The chart suggests some additional softness in the index. |
| Graphic provided by: StockCharts.com. |
| |
| Figure 2, the weekly chart, shares the bearish long-term view. The stochastic (14,3,3) has seen 50 as its strong resistance level in its recent run as well. The index lost its strongest support of a 200-day moving average in October and November as the oscillator failed to surge above the 50 levels. Since then, $BKX has lost approximately 30 points. The resistance then never converted to support. Again, the moving averages are showing a bearish crossover possibility, which can further weaken the index. The MACD (12,26,9) also indicates volatility as the indicator tried to turn bullish. |
| The overall scenario points to some further correction but we are talking very long-term. |
Active trader in the Indian stock markets since 2003 and a full-time writer. Trading is largely based upon technical analysis.
| Company: | Independent |
| Address: | C1/3 Parth Indraprasth Towers. Vastrapur |
| Ahmedabad, Guj 380015 | |
| E-mail address: | chaitalimohile@yahoo.co.in |
Traders' Resource Links | |
| Independent has not added any product or service information to TRADERS' RESOURCE. | |
Click here for more information about our publications!
Comments
Date: 03/12/08Rank: 3Comment:

|

Request Information From Our Sponsors
- VectorVest, Inc.
- Executive Premier Workshop
- One-Day Options Course
- OptionsPro
- Retirement Income Workshop
- Sure-Fire Trading Systems (VectorVest, Inc.)
- Trading as a Business Workshop
- VectorVest 7 EOD
- VectorVest 7 RealTime/IntraDay
- VectorVest AutoTester
- VectorVest Educational Services
- VectorVest OnLine
- VectorVest Options Analyzer
- VectorVest ProGraphics v6.0
- VectorVest ProTrader 7
- VectorVest RealTime Derby Tool
- VectorVest Simulator
- VectorVest Variator
- VectorVest Watchdog
- StockCharts.com, Inc.
- Candle Patterns
- Candlestick Charting Explained
- Intermarket Technical Analysis
- John Murphy on Chart Analysis
- John Murphy's Chart Pattern Recognition
- John Murphy's Market Message
- MurphyExplainsMarketAnalysis-Intermarket Analysis
- MurphyExplainsMarketAnalysis-Visual Analysis
- StockCharts.com
- Technical Analysis of the Financial Markets
- The Visual Investor
