HOT TOPICS LIST
- MACD
- Fibonacci
- RSI
- Gann
- ADXR
- Stochastics
- Volume
- Triangles
- Futures
- Cycles
- Volatility
- ZIGZAG
- MESA
- Retracement
- Aroon
INDICATORS LIST
LIST OF TOPICS
PRINT THIS ARTICLE
by Chaitali Mohile
LKQX is showing indications of topping out with an overheated long-term trend. A long trading range was taken off by a gap up, but a shooting star turned down the breakout in sideways action.
Position: N/A
Chaitali Mohile
Active trader in the Indian stock markets since 2003 and a full-time writer. Trading is largely based upon technical analysis.
PRINT THIS ARTICLE
CHART ANALYSIS
LKQ May See Hard Days In Near Future
03/05/08 01:08:21 PMby Chaitali Mohile
LKQX is showing indications of topping out with an overheated long-term trend. A long trading range was taken off by a gap up, but a shooting star turned down the breakout in sideways action.
Position: N/A
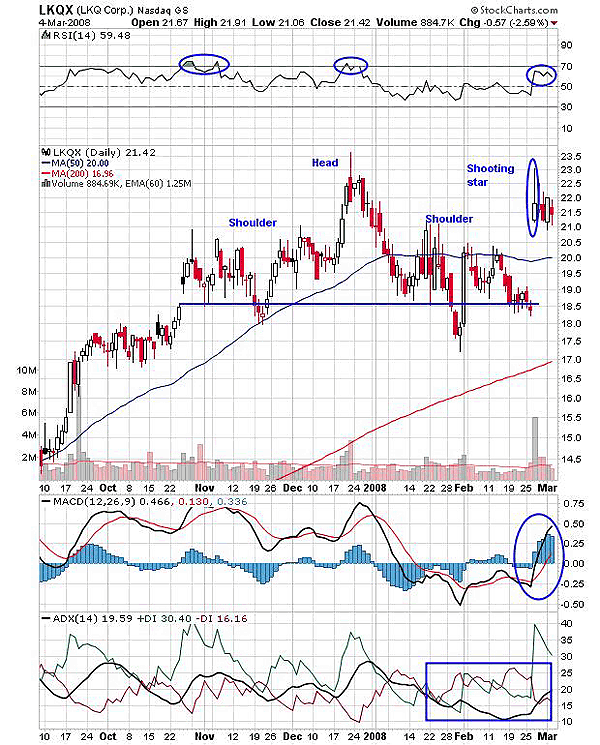
| A shooting star is a bearish reversal pattern with a small real body at the bottom and a long upper shadow. The pattern, however, does not reveal a strong reversal signal but does indicate an end to the upward rally. Further, the pattern appears at the market top. In Figure 1, a shooting star appeared after a gap up of about three points that violated the strong upper range of a previous sideways rally. The shooting star suggested that the rally was unable to sustain the day's high, indicating that weakness was under way. The shooting star here did not turn and fall immediately, but the breakout turned sideways instead of rallying ahead. Second, the breakout faced the resistance of a prior high at the 22.5-23 area. |
| In addition, the daily chart shown in Figure 2 shows that since November 2007 the stock has entered in a sideways consolidation in the range of 18.5 (lower line) and 20.5-21 (upper line). In the middle of the move, the stock crossed the upper range and rallied to 23 with marginal increase in volume. Thus, the entire consolidation phase looks like a head & shoulder top with multiple shoulders with the neckline at 18.5. The pattern usually breaks below the neckline, but here the gap up occurred with a shooting star. So we consider the head & shoulder top as just a warning till any particular move appears in the stock. |

|
| FIGURE 1: LKQX, DAILY. The prior high pivot and shooting star appearance restricted the gap up breakout. Neither of the indicators are too positive to support the rally on the breakout. The consolidation at higher levels formed a head & shoulders top. |
| Graphic provided by: StockCharts.com. |
| |
| With resistance at 23, the shooting star formed after the gap up turned the price action horizontal as was the relative strength index (RSI) (14). The oscillator, like its earlier move in November and December 2007, found it difficult to cross its overbought area, resulting in lowering confidence. The moving average convergence/divergence (MACD) shows a wild surge in positive territory after a bullish crossover. And the average directional movement index (ADX) (14) is struggling near 20 to capture the uptrend as the buying pressure is much higher than the selling pressure. Summed together, LKQX may find it difficult to rally higher. |

|
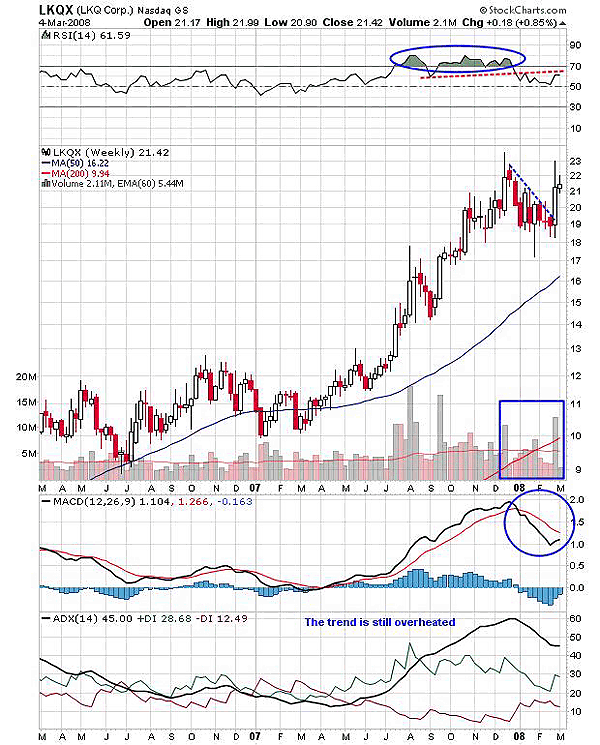
| FIGURE 2: LKQX, WEEKLY. The uptrend in LKQX was highly overheated in November–December, resulting in a price correction. The RSI (14) shows negative divergence and the MACD (12,26,9) indicate weakness as well. |
| Graphic provided by: StockCharts.com. |
| |
| The ADX (14) was highly overheated in November-December 2007 as the stock rallied higher. The trend indicator started declining from the 60 area, resulting in a correction in price. The stock plunged from 23 to 19 while the ADX (14) was descending. The indicator is still in an overheated area, thus indicating that some more correction is to come in the next few weeks. In addition, RSI (14) shows negative divergence as the RSI formed lower highs while the price was at its prior high pivot. And the MACD (12,26,9) is below its trigger line, reflecting a weakness in the rally. |
| The indicators in Figure 2 are not favoring any bullish move in the near future. The breakout on the daily chart in Figure 1 has turned sideways, with a shooting star that appeared immediately after the gap up. No trade is recommended on either side. |
Active trader in the Indian stock markets since 2003 and a full-time writer. Trading is largely based upon technical analysis.
| Company: | Independent |
| Address: | C1/3 Parth Indraprasth Towers. Vastrapur |
| Ahmedabad, Guj 380015 | |
| E-mail address: | chaitalimohile@yahoo.co.in |
Traders' Resource Links | |
| Independent has not added any product or service information to TRADERS' RESOURCE. | |
Click here for more information about our publications!
Comments
Date: 03/05/08Rank: 2Comment:
Date: 03/12/08Rank: 1Comment:

Request Information From Our Sponsors
- VectorVest, Inc.
- Executive Premier Workshop
- One-Day Options Course
- OptionsPro
- Retirement Income Workshop
- Sure-Fire Trading Systems (VectorVest, Inc.)
- Trading as a Business Workshop
- VectorVest 7 EOD
- VectorVest 7 RealTime/IntraDay
- VectorVest AutoTester
- VectorVest Educational Services
- VectorVest OnLine
- VectorVest Options Analyzer
- VectorVest ProGraphics v6.0
- VectorVest ProTrader 7
- VectorVest RealTime Derby Tool
- VectorVest Simulator
- VectorVest Variator
- VectorVest Watchdog
- StockCharts.com, Inc.
- Candle Patterns
- Candlestick Charting Explained
- Intermarket Technical Analysis
- John Murphy on Chart Analysis
- John Murphy's Chart Pattern Recognition
- John Murphy's Market Message
- MurphyExplainsMarketAnalysis-Intermarket Analysis
- MurphyExplainsMarketAnalysis-Visual Analysis
- StockCharts.com
- Technical Analysis of the Financial Markets
- The Visual Investor
