HOT TOPICS LIST
- MACD
- Fibonacci
- RSI
- Gann
- ADXR
- Stochastics
- Volume
- Triangles
- Futures
- Cycles
- Volatility
- ZIGZAG
- MESA
- Retracement
- Aroon
INDICATORS LIST
LIST OF TOPICS
PRINT THIS ARTICLE
by Arthur Hill
After a sharp decline late last week, the Dow Jones Industrial Average failed to reclaim broken support, and the downtrend looks set to continue.
Position: Sell
Arthur Hill
Arthur Hill is currently editor of TDTrader.com, a website specializing in trading strategies, sector/industry specific breadth stats and overall technical analysis. He passed the Society of Technical Analysts (STA London) diploma exam with distinction is a Certified Financial Technician (CFTe). Prior to TD Trader, he was the Chief Technical Analyst for Stockcharts.com and the main contributor to the ChartSchool.
PRINT THIS ARTICLE
SUPPORT & RESISTANCE
Dow Fails At Broken Support
03/04/08 11:24:00 AMby Arthur Hill
After a sharp decline late last week, the Dow Jones Industrial Average failed to reclaim broken support, and the downtrend looks set to continue.
Position: Sell
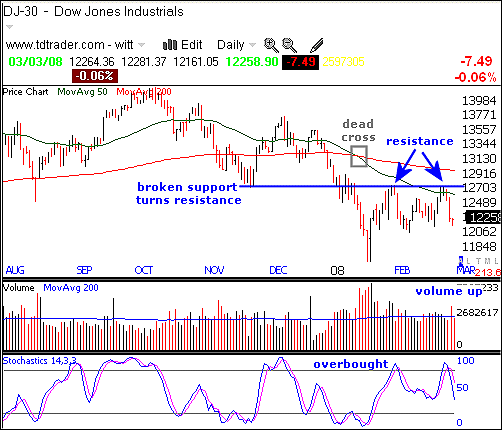
| First and foremost, the overall trend is down for the Dow industrials. The average formed a lower high in December and broke below its November low in January. A lower high and a lower low define a clear downtrend. In addition, the 50-day moving average moved below the 200-day moving average in January. The 200-day moving average is also falling now and the January support break occurred on expanding volume. The bulls are looking mighty weak. |
| Broken support turned into resistance around 12700 and this support break held. The average tried to move back above the support break at the end of January and again in February. Both attempts failed and 12700 is the level to beat. The overall trend is clearly down as long as this level holds. With a downtrend in place, the odds favor another lower low and this implies a break below the January low. |

|
| FIGURE 1: DJIA, DAILY. The stochastic oscillator confirmed resistance with its second overbought reading. |
| Graphic provided by: TeleChart2007. |
| |
| The stochastic oscillator confirmed resistance with its second overbought reading (Figure 1). The indicator becomes overbought when it is above 80 and oversold when below 20. Both moves above 80 corresponded with the February highs. The oscillator crossed below 80 and below its signal line over the last three days. This acts as a sell signal and a move toward oversold levels is expected (<20). |
Arthur Hill is currently editor of TDTrader.com, a website specializing in trading strategies, sector/industry specific breadth stats and overall technical analysis. He passed the Society of Technical Analysts (STA London) diploma exam with distinction is a Certified Financial Technician (CFTe). Prior to TD Trader, he was the Chief Technical Analyst for Stockcharts.com and the main contributor to the ChartSchool.
| Title: | Editor |
| Company: | TDTrader.com |
| Address: | Willem Geetsstraat 17 |
| Mechelen, B2800 | |
| Phone # for sales: | 3215345465 |
| Website: | www.tdtrader.com |
| E-mail address: | arthurh@tdtrader.com |
Traders' Resource Links | |
| TDTrader.com has not added any product or service information to TRADERS' RESOURCE. | |
Click here for more information about our publications!
Comments
Date: 03/05/08Rank: 5Comment:

Request Information From Our Sponsors
- VectorVest, Inc.
- Executive Premier Workshop
- One-Day Options Course
- OptionsPro
- Retirement Income Workshop
- Sure-Fire Trading Systems (VectorVest, Inc.)
- Trading as a Business Workshop
- VectorVest 7 EOD
- VectorVest 7 RealTime/IntraDay
- VectorVest AutoTester
- VectorVest Educational Services
- VectorVest OnLine
- VectorVest Options Analyzer
- VectorVest ProGraphics v6.0
- VectorVest ProTrader 7
- VectorVest RealTime Derby Tool
- VectorVest Simulator
- VectorVest Variator
- VectorVest Watchdog
- StockCharts.com, Inc.
- Candle Patterns
- Candlestick Charting Explained
- Intermarket Technical Analysis
- John Murphy on Chart Analysis
- John Murphy's Chart Pattern Recognition
- John Murphy's Market Message
- MurphyExplainsMarketAnalysis-Intermarket Analysis
- MurphyExplainsMarketAnalysis-Visual Analysis
- StockCharts.com
- Technical Analysis of the Financial Markets
- The Visual Investor
