HOT TOPICS LIST
- MACD
- Fibonacci
- RSI
- Gann
- ADXR
- Stochastics
- Volume
- Triangles
- Futures
- Cycles
- Volatility
- ZIGZAG
- MESA
- Retracement
- Aroon
INDICATORS LIST
LIST OF TOPICS
PRINT THIS ARTICLE
by Mike Carr, CMT
Well known but rarely tested, technical tools like the relative strength index can be profitable if used properly.
Position: N/A
Mike Carr, CMT
Mike Carr, CMT, is a member of the Market Technicians Association, and editor of the MTA's newsletter, Technically Speaking. He is also the author of "Smarter Investing in Any Economy: The Definitive Guide to Relative Strength Investing," and "Conquering the Divide: How to Use Economic Indicators to Catch Stock Market Trends."
PRINT THIS ARTICLE
RSI
Does RSI Work?
03/03/08 09:30:00 AMby Mike Carr, CMT
Well known but rarely tested, technical tools like the relative strength index can be profitable if used properly.
Position: N/A
| Price oscillators are commonly added to charts and are useful for assessing whether a price trend is likely to continue. A well-known oscillator is the relative strength index (RSI), which was developed by J. Welles Wilder and introduced to the world in 1978. This oscillator compares the size of recent gains to recent losses in an attempt to determine overbought and oversold conditions of an asset. The formula is relatively simple: RSI = 100 - [100/(1 + RS)] where RS represents the average of x days' up closes divided by the average of x days' down closes. |
| Although it's a relatively simple formula, it can use some explanation. This calculation will always return a value between zero and 100, giving it clear boundaries. We will use a 14-day RSI for this example. The RS value averages the daily change on up days during that time and divides it by the average change on down days over the past 14 trading days. If there were 10 up days, the net gains are added and divided by 10 for the numerator; the net changes for the remaining four days are summed and divided by 4 to derive the denominator of RS. |
| Oscillators build on the idea that price movement is like a rubber band and will snap back if pulled too far. As RSI approaches 100, it is said to be overbought, indicating that everyone looking to buy has already bought. At the other extreme, near zero, RSI is oversold. Any oscillator, including RSI, works best during trading ranges, when a clear trend cannot be easily identified. |
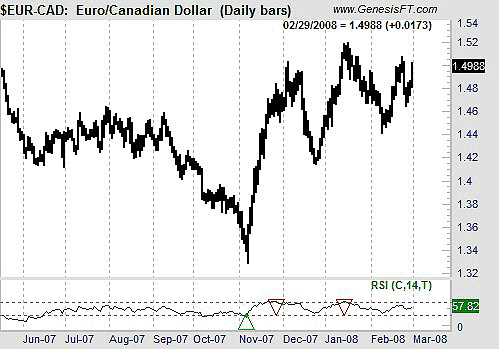
| Usually, traders will consider the overbought level to be 70 and will look at selling when it reaches this level. An RSI reading of 30 is an indication that price has gotten oversold and is likely to be undervalued. This idea is shown in Figure 1, a daily chart of the euro/Canadian dollar currency pair. |

|
| FIGURE 1: EUR/CAD. Some signals generated with RSI can be extremely profitable, such as the November 2007 buy signal in the EUR/CAD currency pair. |
| Graphic provided by: Trade Navigator. |
| |
| Some signals work, while others are early or late. Because markets can appear to be irrational at times, a better strategy is to buy when the oversold or overbought condition reverses, signaling the trend has run its course. Testing against the euro/Canadian dollar currency pair shows that this simple RSI strategy can work surprisingly well. Selling short when RSI falls below 70 and buying when RSI breaks above 30 led to 20 consecutive winning trades since 1999, with an average profit of $536. We exited on the first profitable open or with a $2,700 stop-loss. RSI can be used as a standalone trading system, or as confirmation of other signals. Traders can use this oscillator to significantly improve their profits. |
Mike Carr, CMT, is a member of the Market Technicians Association, and editor of the MTA's newsletter, Technically Speaking. He is also the author of "Smarter Investing in Any Economy: The Definitive Guide to Relative Strength Investing," and "Conquering the Divide: How to Use Economic Indicators to Catch Stock Market Trends."
| Website: | www.moneynews.com/blogs/MichaelCarr/id-73 |
| E-mail address: | marketstrategist@gmail.com |
Click here for more information about our publications!
Comments
Date: 03/04/08Rank: 5Comment:
Date: 03/04/08Rank: 5Comment:
Date: 03/13/08Rank: 5Comment: great article
Date: 06/15/08Rank: 2Comment:

Request Information From Our Sponsors
- VectorVest, Inc.
- Executive Premier Workshop
- One-Day Options Course
- OptionsPro
- Retirement Income Workshop
- Sure-Fire Trading Systems (VectorVest, Inc.)
- Trading as a Business Workshop
- VectorVest 7 EOD
- VectorVest 7 RealTime/IntraDay
- VectorVest AutoTester
- VectorVest Educational Services
- VectorVest OnLine
- VectorVest Options Analyzer
- VectorVest ProGraphics v6.0
- VectorVest ProTrader 7
- VectorVest RealTime Derby Tool
- VectorVest Simulator
- VectorVest Variator
- VectorVest Watchdog
- StockCharts.com, Inc.
- Candle Patterns
- Candlestick Charting Explained
- Intermarket Technical Analysis
- John Murphy on Chart Analysis
- John Murphy's Chart Pattern Recognition
- John Murphy's Market Message
- MurphyExplainsMarketAnalysis-Intermarket Analysis
- MurphyExplainsMarketAnalysis-Visual Analysis
- StockCharts.com
- Technical Analysis of the Financial Markets
- The Visual Investor
