HOT TOPICS LIST
- MACD
- Fibonacci
- RSI
- Gann
- ADXR
- Stochastics
- Volume
- Triangles
- Futures
- Cycles
- Volatility
- ZIGZAG
- MESA
- Retracement
- Aroon
INDICATORS LIST
LIST OF TOPICS
PRINT THIS ARTICLE
by Koos van der Merwe
Buy when the market goes up and buy when the market goes down. It's that simple.
Position: Buy
Koos van der Merwe
Has been a technical analyst since 1969, and has worked as a futures and options trader with First Financial Futures in Johannesburg, South Africa.
PRINT THIS ARTICLE
TRADING SYSTEMS
How To Play Both Sides Of The Market?
03/03/08 09:21:30 AMby Koos van der Merwe
Buy when the market goes up and buy when the market goes down. It's that simple.
Position: Buy
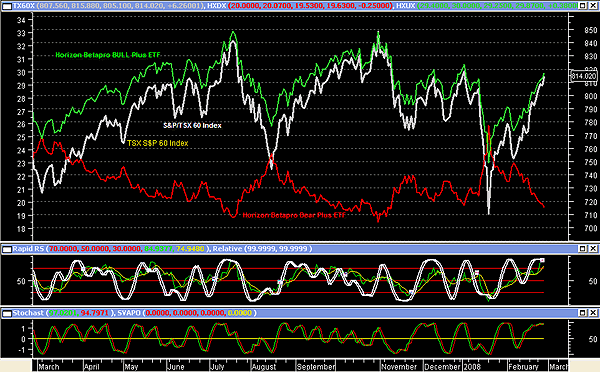
| Horizon BetaPro ETFs are a unique series of alternative index exchange traded funds designed to help investors achieve their investment goals in all market conditions. They are designed to double the daily performance of the index they mimic — for example, the H&P Bear Plus Fund offers twice the daily return opposite to the direction of the index. As the index falls, the Bear Plus fund rises, and at twice the rate. Effectively and combined, the funds allow investors to profit in all market environments. See Figure 1. |

|
| FIGURE 1: HXU-T, HXD-T. Here's a chart showing the S&P/TSX 60 index with the Horizon BetaPro Bull and Bear ETFs. |
| Graphic provided by: MetaStock. |
| |
| The funds are offered across the index spectrum, and can be traded in Canadian dollars or US dollars and cover the entire US and Canadian spectrum. There are no trading restrictions, are extremely liquid with a 200% daily exposure and immediate settlement. Unlike a short sale, the risk is limited to the amount of capital invested. For Canadians, they are RRSP eligible, which means any profits made are nontaxable. A list of funds offered can be found on the website http://www.hbpetfs.com/. |
| Figure 1 is of the S&P/TSX 60 Bull Plus and Bear Plus ETF as they perform against the Canadian S&P/TSX 60 Index. The Index is in white, while the S&P/TSX Bull Plus is in green and the Bear Plus is in red. You can see how close the Bull Plus ETF moves relative to the index, with the Bear Plus ETF is a mirror image, moving opposite to the Bull Plus ETF. |
| So... how to play it? Simple: Buy the S&P/TSX 60m Bull ETF (HXU-T) when the market is bullish, then sell it and buy the S&P/TSX 60 BEAR ETF (HXD-T) when the market is falling. The indicators shown on the chart are, in the upper box, the relative strength spread (white) and rapid RSI (green and yellow) lines. In the lower box the indicator is a stochastic RSI indicator. All the indicators are at oversold levels, suggesting that one should consider selling the HXU-T and buying the HXD-T. |
Has been a technical analyst since 1969, and has worked as a futures and options trader with First Financial Futures in Johannesburg, South Africa.
| Address: | 3256 West 24th Ave |
| Vancouver, BC | |
| Phone # for sales: | 6042634214 |
| E-mail address: | petroosp@gmail.com |
Click here for more information about our publications!
Comments
Date: 03/04/08Rank: 1Comment:

Request Information From Our Sponsors
- StockCharts.com, Inc.
- Candle Patterns
- Candlestick Charting Explained
- Intermarket Technical Analysis
- John Murphy on Chart Analysis
- John Murphy's Chart Pattern Recognition
- John Murphy's Market Message
- MurphyExplainsMarketAnalysis-Intermarket Analysis
- MurphyExplainsMarketAnalysis-Visual Analysis
- StockCharts.com
- Technical Analysis of the Financial Markets
- The Visual Investor
- VectorVest, Inc.
- Executive Premier Workshop
- One-Day Options Course
- OptionsPro
- Retirement Income Workshop
- Sure-Fire Trading Systems (VectorVest, Inc.)
- Trading as a Business Workshop
- VectorVest 7 EOD
- VectorVest 7 RealTime/IntraDay
- VectorVest AutoTester
- VectorVest Educational Services
- VectorVest OnLine
- VectorVest Options Analyzer
- VectorVest ProGraphics v6.0
- VectorVest ProTrader 7
- VectorVest RealTime Derby Tool
- VectorVest Simulator
- VectorVest Variator
- VectorVest Watchdog
