HOT TOPICS LIST
- MACD
- Fibonacci
- RSI
- Gann
- ADXR
- Stochastics
- Volume
- Triangles
- Futures
- Cycles
- Volatility
- ZIGZAG
- MESA
- Retracement
- Aroon
INDICATORS LIST
LIST OF TOPICS
PRINT THIS ARTICLE
by David Penn
Nothing lasts forever ... not even the year-long advance of healthcare stocks.
Position: N/A
David Penn
Technical Writer for Technical Analysis of STOCKS & COMMODITIES magazine, Working-Money.com, and Traders.com Advantage.
PRINT THIS ARTICLE
THE DIAMOND
HCA's Diamond Top
03/14/01 02:19:05 PMby David Penn
Nothing lasts forever ... not even the year-long advance of healthcare stocks.
Position: N/A
| For some time, healthcare stocks were doing what other stocks could not, namely advance steadily throughout 2000. The Standard and Poor's Healthcare Index, for example, rose 33% in 2000, while other popular sectors such as semiconductors and biotechnology took major knocks. If you're reading this good news about the healthcare sector now, then the only question you might have is: "Is it too late to get in?" |
| Whether or not it is too late in the spring of 2001 to take advantage of the run a group of stocks had in 2000 probably depends on the group of stocks. Think for example of what might have happened to someone trying to "get in" to biotech or semiconductors in 2000 after the wonderful run both groups had in 1999. But one approach for those interested in buying healthcare would be to look through some of the better healthcare companies looking for tops. If there is little time left to benefit from healthcare's 2000 advance, there may still be plenty of time to take advantage of healthcare on the way down. |

|
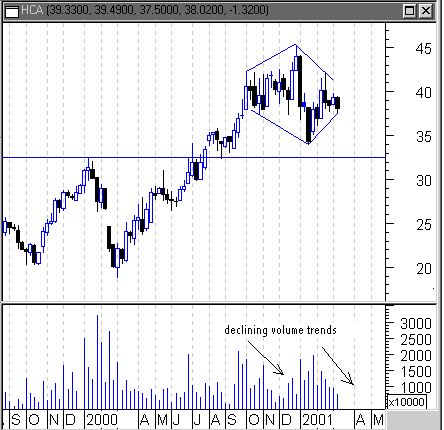
| Volume tends to subside during the development of a diamond top, only to surge on the downside breakout. The downside price objective from this diamond top is $22.50. |
| Graphic provided by: MetaStock. |
| |
| Down?! Let's take a look at one of the gems in healthcare-- The HealthCare Corporation [HCA]. This stock came to my attention as part of a positive analyst recommendation but, thinking about the performance the healthcare group had in 2000, I wondered if HCA might have already had its day in the sun. A weekly chart of HCA revealed the great advance the stock achieved in 2000, but also saw that advance run straight into a diamond top, starting in September 2000 and looking to be completed in March 2001. |
| A diamond top is a bearish reversal pattern, rising as a sort of plateau at the end of a significant price advance. In a diamond top, prices tend to rise up to the formation, where they begin narrowing, making lower highs and lower lows. Prices grow in range, making higher highs and lower lows, as volume decreases and buying interest subsides. Near the end of the formation, with volume at its lowest, price ranges begin to narrow again. In the case of diamond tops, a downside breakout on strong volume often occurs next. |
| The resulting shape of the formation then is a diamond, with four trendlines tracing the advancing and declining highs, as well as the declining and advancing lows. What can be expected from a diamond top? By measuring the size of the formation, highest high to lowest low, and subtracting that value from the point where prices breakout of the diamond pattern, we can arrive at a reasonable downside expectation from a diamond top. In this case, with a formation height of 11.50 and prices edging toward the diamond boundary at about $34, we note a downside price objective of around $22.50. |
Technical Writer for Technical Analysis of STOCKS & COMMODITIES magazine, Working-Money.com, and Traders.com Advantage.
| Title: | Technical Writer |
| Company: | Technical Analysis, Inc. |
| Address: | 4757 California Avenue SW |
| Seattle, WA 98116 | |
| Phone # for sales: | 206 938 0570 |
| Fax: | 206 938 1307 |
| Website: | www.Traders.com |
| E-mail address: | DPenn@traders.com |
Traders' Resource Links | |
| Charting the Stock Market: The Wyckoff Method -- Books | |
| Working-Money.com -- Online Trading Services | |
| Traders.com Advantage -- Online Trading Services | |
| Technical Analysis of Stocks & Commodities -- Publications and Newsletters | |
| Working Money, at Working-Money.com -- Publications and Newsletters | |
| Traders.com Advantage -- Publications and Newsletters | |
| Professional Traders Starter Kit -- Software | |
Click here for more information about our publications!
Comments

Request Information From Our Sponsors
- StockCharts.com, Inc.
- Candle Patterns
- Candlestick Charting Explained
- Intermarket Technical Analysis
- John Murphy on Chart Analysis
- John Murphy's Chart Pattern Recognition
- John Murphy's Market Message
- MurphyExplainsMarketAnalysis-Intermarket Analysis
- MurphyExplainsMarketAnalysis-Visual Analysis
- StockCharts.com
- Technical Analysis of the Financial Markets
- The Visual Investor
- VectorVest, Inc.
- Executive Premier Workshop
- One-Day Options Course
- OptionsPro
- Retirement Income Workshop
- Sure-Fire Trading Systems (VectorVest, Inc.)
- Trading as a Business Workshop
- VectorVest 7 EOD
- VectorVest 7 RealTime/IntraDay
- VectorVest AutoTester
- VectorVest Educational Services
- VectorVest OnLine
- VectorVest Options Analyzer
- VectorVest ProGraphics v6.0
- VectorVest ProTrader 7
- VectorVest RealTime Derby Tool
- VectorVest Simulator
- VectorVest Variator
- VectorVest Watchdog
