

HOT TOPICS LIST
- MACD
- Fibonacci
- RSI
- Gann
- ADXR
- Stochastics
- Volume
- Triangles
- Futures
- Cycles
- Volatility
- ZIGZAG
- MESA
- Retracement
- Aroon
INDICATORS LIST
LIST OF TOPICS
PRINT THIS ARTICLE
by Alan R. Northam
Expanding diagonal formations often show up on the price chart after a substantial price rally or at the end of a correction and are known as ending formations that signal a forthcoming reversal in trend.
Position: N/A
Alan R. Northam
Alan Northam lives in the Dallas, Texas area and as an electronic engineer gave him an analytical mind from which he has developed a thorough knowledge of stock market technical analysis. His abilities to analyze the future direction of the stock market has allowed him to successfully trade of his own portfolio over the last 30 years. Mr. Northam is now retired and trading the stock market full time. You can reach him at inquiry@tradersclassroom.com or by visiting his website at http://www.tradersclassroom.com. You can also follow him on Twitter @TradersClassrm.
PRINT THIS ARTICLE
ELLIOTT WAVE
Gold Rush Playing Out
02/29/08 09:07:07 AMby Alan R. Northam
Expanding diagonal formations often show up on the price chart after a substantial price rally or at the end of a correction and are known as ending formations that signal a forthcoming reversal in trend.
Position: N/A
| Some 70 years ago, Ralph Nelson Elliott studied the movements of the stock market and discovered that certain repetitious wave patterns existed much as Charles Dow had previously discovered. However, the work of R.N. Elliott went beyond that of Charles Dow. Among these repetitious waves, Elliott discovered that expanding diagonal patterns show up on the price chart after a substantial price rally or at the end of a correction and are known as ending formations that signal a forthcoming reversal in trend. However, price rallies and corrections do not always end with an expanding diagonal formation. Expanding diagonal patterns are made up of five overlapping waves, waves 1, 2, 3, 4, and 5. In a bull market the lower price minima of waves 2 and 4 form an upward sloping support line while the price peaks of waves 1 and 3 form an upward-sloping resistance line, sloping upward at an angle greater than that of the support line. During the final stage of wave 5, the price will usually break through the upward-sloping resistance line of the expanding diagonal pattern, but this is not a requirement. When price does break through the upward sloping resistance line, it is called a "throwover." Volume tends to diminish as the formation progresses and will usually spike during the throwover. Following the throwover, price normally turns back downward. The expanding diagonal pattern is completed when price breaks below its upward-sloping support line, signaling the beginning of the trend reversal. |
| Figure 1 below shows the price and volume chart of streetTRACKS Gold Trust Shares, with the stock symbol "GLD," which has been forming an expanding diagonal pattern since the beginning of the year. This expanding diagonal pattern is forming after a long substantial price rise, most of which has occurred off the left side of the chart. The expanding diagonal formation is not yet complete as prospectors (buyers) are still seeking their fortune (profits) in gold. To date, waves 1, 2, 3, and 4 have been completed, with wave 5 still in progress. The real gold rush comes near the end of wave 5 when price approaches the upward-sloping resistance line. At this time price will normally break through this line of resistance, "throw over," in a rush for immediate higher prices as volume spikes. It's the last rush for gold as everyone panics to buy as much gold as they can, thinking that gold will go much higher following the breakout. But once everyone has spent all their money panic buying gold, buying power dries up and the gold rush is over. When there is no more money to buy gold, the price of gold hits a peak in price as it cannot move any higher. Once buying power has dried up, profit-taking steps in and drives the price of gold back down, reversing the trend. See Figure 1. |

|
| FIGURE 1: STREET TRACKS GOLD TRUST SHARES, DAILY. Here's the price chart of GLD showing the expanding diagonal pattern. |
| Graphic provided by: StockCharts.com. |
| |
| Once gold starts to sell off and breaks through its lower upward-sloping support line, the first area of support will be the price level of the beginning of the expanding diagonal formation. However, if this support line does not hold, gold could fall to lower support levels. I have shown these support levels in Figure 2. |
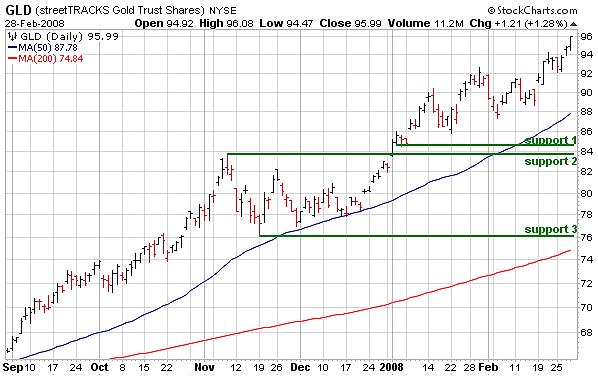
|
| FIGURE 2: STREET TRACKS GOLD TRUST SHARES, DAILY. Here's a chart of GLD showing support price levels. |
| Graphic provided by: StockCharts.com. |
| |
| In Figure 2, I have shown what I believe are the major areas that could provide support for GLD. Support 1 is taken off the price level at the beginning of the expanding diagonal formation. Support 2 is taken from the November price high and support 3 the November price low. In addition to these support levels, the 50-day moving average could provide some intermediate-term price support, while the 200-day moving average could provide long-term support. Should GLD move significantly below its 200-day moving average, then expect a long-term bear market for gold. |
| A wise trader will not try to out-guess the formation by taking a position during its creation but will patiently wait for its completion before taking action. Once price breaks out below the upward sloping support line of the expanding diagonal pattern, the trader will know that the trend is reversing and can then take action. However, if price does not reverse its trend, the trader will know that the expanding diagonal pattern is a false formation and prices will most likely continue higher. Although the gold rush in GLD has not played itself out yet and prospectors (buyers) are still buying gold in hopes of making a profit in the future, the expanding diagonal formation is letting traders know that there is a high probability the rush to buy GLD could be coming to an end. |
Alan Northam lives in the Dallas, Texas area and as an electronic engineer gave him an analytical mind from which he has developed a thorough knowledge of stock market technical analysis. His abilities to analyze the future direction of the stock market has allowed him to successfully trade of his own portfolio over the last 30 years. Mr. Northam is now retired and trading the stock market full time. You can reach him at inquiry@tradersclassroom.com or by visiting his website at http://www.tradersclassroom.com. You can also follow him on Twitter @TradersClassrm.
| Garland, Tx | |
| Website: | www.tradersclassroom.com |
| E-mail address: | inquiry@tradersclassroom.com |
Click here for more information about our publications!
Comments
Date:�03/03/08Rank:�2Comment:�
Date:�03/04/08Rank:�4Comment:�

Request Information From Our Sponsors
- StockCharts.com, Inc.
- Candle Patterns
- Candlestick Charting Explained
- Intermarket Technical Analysis
- John Murphy on Chart Analysis
- John Murphy's Chart Pattern Recognition
- John Murphy's Market Message
- MurphyExplainsMarketAnalysis-Intermarket Analysis
- MurphyExplainsMarketAnalysis-Visual Analysis
- StockCharts.com
- Technical Analysis of the Financial Markets
- The Visual Investor
- VectorVest, Inc.
- Executive Premier Workshop
- One-Day Options Course
- OptionsPro
- Retirement Income Workshop
- Sure-Fire Trading Systems (VectorVest, Inc.)
- Trading as a Business Workshop
- VectorVest 7 EOD
- VectorVest 7 RealTime/IntraDay
- VectorVest AutoTester
- VectorVest Educational Services
- VectorVest OnLine
- VectorVest Options Analyzer
- VectorVest ProGraphics v6.0
- VectorVest ProTrader 7
- VectorVest RealTime Derby Tool
- VectorVest Simulator
- VectorVest Variator
- VectorVest Watchdog