HOT TOPICS LIST
- MACD
- Fibonacci
- RSI
- Gann
- ADXR
- Stochastics
- Volume
- Triangles
- Futures
- Cycles
- Volatility
- ZIGZAG
- MESA
- Retracement
- Aroon
INDICATORS LIST
LIST OF TOPICS
PRINT THIS ARTICLE
by Gary Grosschadl
After a big rise, stocks will often languish sideways or correct down before making another bull move.
Position: N/A
Gary Grosschadl
Independent Canadian equities trader and technical analyst based in Peterborough
Ontario, Canada.
PRINT THIS ARTICLE
MOVING AVERAGES
Millennium Pharmaceuticals Bouncing Off Strong Support
02/28/08 08:59:03 AMby Gary Grosschadl
After a big rise, stocks will often languish sideways or correct down before making another bull move.
Position: N/A
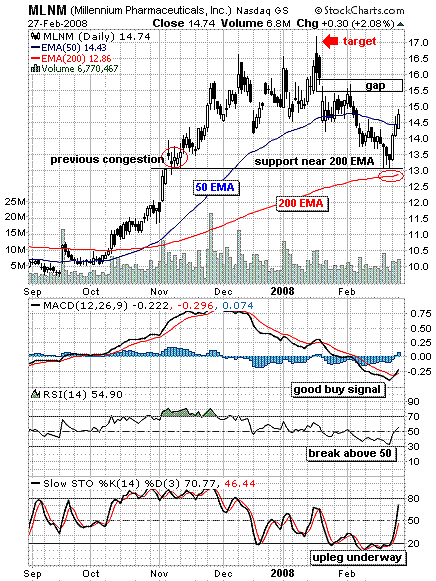
| Figure 1 shows an admirable gain from last autumn, rising near 65% in only three months. Note the classic buy signal when the 50-day exponential moving average (EMA) crossed over the 200-day EMA. It languished sideways for about the same time frame, extinguishing the final bulls after a brief attempt at $17. The 50-day EMA held brief support until a convincing black candlestick closed beneath it. |
| The first sign of possible support came with the hammer candlestick just above $13. That mark held support in the next two trading days. Note how that level corresponded with a previous congestion level from last November. The other major consideration was the close proximity to the ever-important 200-day EMA. Stocks often respect that strong level of support or resistance. |

|
| FIGURE 1: MLNM, DAILY. This chart shows a bounce near strong support. |
| Graphic provided by: StockCharts.com. |
| |
| Below the chart, several indicators are considered. The moving average convergence/divergence (MACD) shows a strong buy signal. After a large decline to below the zero-line, a bullish crossover is one of my favorite buy signals. This indicator lags a little (by several days) so it is not meant to time the precise bottom. The relative strength signal (RSI) shows a similar move to a low level bouncing off 30. The move above the often key resistance area of 50 is another bullish sign. As expected, the stochastic oscillator shows a bullish up leg. A downturn from the 80 level usually points to some type of consolidation as the stock takes a breather, or possible reversal. |
| There are two considerations for an upside target. The first is a possible gap resistance near 15.50. The stock may balk at that point and have to reload before mustering a stab at the previous high near $17. A move beyond $17 is not ruled out, but there would have to be some bullish catalyst to bring in new bulls at that level — perhaps bullish news for the stock or the market in general. Should this drive turn sour, keep your eye on the 50-day EMA. This level must hold support or all bullish bets are off. Failure to hold support would likely bring another test of the 200-day EMA. |
Independent Canadian equities trader and technical analyst based in Peterborough
Ontario, Canada.
| Website: | www.whatsonsale.ca/financial.html |
| E-mail address: | gwg7@sympatico.ca |
Click here for more information about our publications!
Comments
Date: 03/03/08Rank: 4Comment:
Date: 03/04/08Rank: 5Comment:

Request Information From Our Sponsors
- StockCharts.com, Inc.
- Candle Patterns
- Candlestick Charting Explained
- Intermarket Technical Analysis
- John Murphy on Chart Analysis
- John Murphy's Chart Pattern Recognition
- John Murphy's Market Message
- MurphyExplainsMarketAnalysis-Intermarket Analysis
- MurphyExplainsMarketAnalysis-Visual Analysis
- StockCharts.com
- Technical Analysis of the Financial Markets
- The Visual Investor
- VectorVest, Inc.
- Executive Premier Workshop
- One-Day Options Course
- OptionsPro
- Retirement Income Workshop
- Sure-Fire Trading Systems (VectorVest, Inc.)
- Trading as a Business Workshop
- VectorVest 7 EOD
- VectorVest 7 RealTime/IntraDay
- VectorVest AutoTester
- VectorVest Educational Services
- VectorVest OnLine
- VectorVest Options Analyzer
- VectorVest ProGraphics v6.0
- VectorVest ProTrader 7
- VectorVest RealTime Derby Tool
- VectorVest Simulator
- VectorVest Variator
- VectorVest Watchdog
