

HOT TOPICS LIST
- MACD
- Fibonacci
- RSI
- Gann
- ADXR
- Stochastics
- Volume
- Triangles
- Futures
- Cycles
- Volatility
- ZIGZAG
- MESA
- Retracement
- Aroon
INDICATORS LIST
LIST OF TOPICS
PRINT THIS ARTICLE
by Arthur Hill
Apollo Group broke rectangle support with high volume, and the long-term outlook is now bearish.
Position: Sell
Arthur Hill
Arthur Hill is currently editor of TDTrader.com, a website specializing in trading strategies, sector/industry specific breadth stats and overall technical analysis. He passed the Society of Technical Analysts (STA London) diploma exam with distinction is a Certified Financial Technician (CFTe). Prior to TD Trader, he was the Chief Technical Analyst for Stockcharts.com and the main contributor to the ChartSchool.
PRINT THIS ARTICLE
RECTANGLES
A Rectangle Top For Apollo
02/28/08 11:52:18 AMby Arthur Hill
Apollo Group broke rectangle support with high volume, and the long-term outlook is now bearish.
Position: Sell
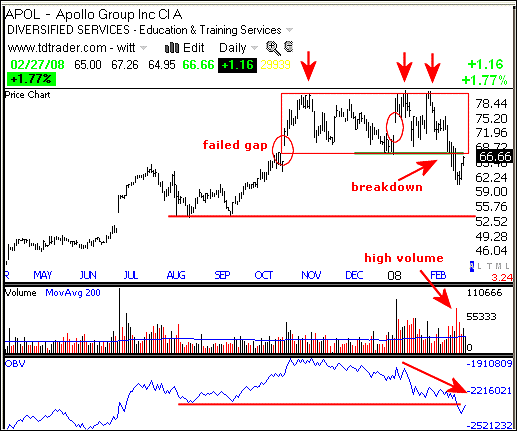
| The rectangle top for Apollo Group (APOL) formed from October 2007 to February 2008. The stock met resistance just above 80 three times in the last five months. The November and January lows established support 67–70. Based on support at 67 and resistance at 82, this rectangle represents a large trading range. The bulls were holding up as long as the range held. However, the stock broke range support with a sharp decline and this broke the bull's back. See Figure 1. |
| Volume surged as the stock broke support and this validated the break. The stock traded above average volume when it declined over the last two weeks (red bars). This shows intense selling pressure that is unlikely to dissipate overnight. The bottom indicator window shows on-balance volume (OBV), which moved below its August low. This indicator also confirms intense selling pressure. Volume often precedes price and the new low in this indicator is bearish. |
|
| FIGURE 1: APOL, DAILY. This stock broke range support with a sharp decline and this broke the bull's back. |
| Graphic provided by: TeleChart2007. |
| |
| The downside target is around 53. There is support in this area from the August–September lows. In addition, the length of the rectangle can be subtracted from the support break for a target. The rectangle extends from 67 to 82 (15 points). The support break was at 67 and this targets a move to 52. Broken support at 67 turns into the first resistance level to watch. |
Arthur Hill is currently editor of TDTrader.com, a website specializing in trading strategies, sector/industry specific breadth stats and overall technical analysis. He passed the Society of Technical Analysts (STA London) diploma exam with distinction is a Certified Financial Technician (CFTe). Prior to TD Trader, he was the Chief Technical Analyst for Stockcharts.com and the main contributor to the ChartSchool.
| Title: | Editor |
| Company: | TDTrader.com |
| Address: | Willem Geetsstraat 17 |
| Mechelen, B2800 | |
| Phone # for sales: | 3215345465 |
| Website: | www.tdtrader.com |
| E-mail address: | arthurh@tdtrader.com |
Traders' Resource Links | |
| TDTrader.com has not added any product or service information to TRADERS' RESOURCE. | |
Click here for more information about our publications!
Comments

Request Information From Our Sponsors
- StockCharts.com, Inc.
- Candle Patterns
- Candlestick Charting Explained
- Intermarket Technical Analysis
- John Murphy on Chart Analysis
- John Murphy's Chart Pattern Recognition
- John Murphy's Market Message
- MurphyExplainsMarketAnalysis-Intermarket Analysis
- MurphyExplainsMarketAnalysis-Visual Analysis
- StockCharts.com
- Technical Analysis of the Financial Markets
- The Visual Investor
- VectorVest, Inc.
- Executive Premier Workshop
- One-Day Options Course
- OptionsPro
- Retirement Income Workshop
- Sure-Fire Trading Systems (VectorVest, Inc.)
- Trading as a Business Workshop
- VectorVest 7 EOD
- VectorVest 7 RealTime/IntraDay
- VectorVest AutoTester
- VectorVest Educational Services
- VectorVest OnLine
- VectorVest Options Analyzer
- VectorVest ProGraphics v6.0
- VectorVest ProTrader 7
- VectorVest RealTime Derby Tool
- VectorVest Simulator
- VectorVest Variator
- VectorVest Watchdog