HOT TOPICS LIST
- MACD
- Fibonacci
- RSI
- Gann
- ADXR
- Stochastics
- Volume
- Triangles
- Futures
- Cycles
- Volatility
- ZIGZAG
- MESA
- Retracement
- Aroon
INDICATORS LIST
LIST OF TOPICS
PRINT THIS ARTICLE
by Chaitali Mohile
Brazil iShares has moved above its previous high resistance on its third attempt on strong volume and may develop a fresh uptrend with this breakout.
Position: Buy
Chaitali Mohile
Active trader in the Indian stock markets since 2003 and a full-time writer. Trading is largely based upon technical analysis.
PRINT THIS ARTICLE
TRADING SYSTEMS
Brazil iShares Has Strong Breakout
02/29/08 09:31:22 AMby Chaitali Mohile
Brazil iShares has moved above its previous high resistance on its third attempt on strong volume and may develop a fresh uptrend with this breakout.
Position: Buy
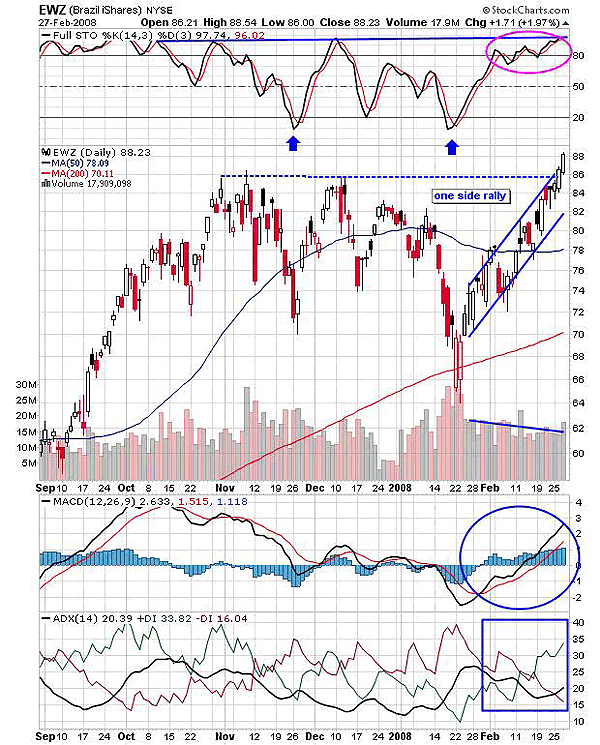
| Brazil iShares (EWZ) had a prior high resistance at 86. In mid-December 2007 the resistance was retested and the attempt to break out failed due to high volatility and low volume. As a result, EWZ plunged even below the support-resistance area of the 50-day moving average, thrusting deep below the long-term support. Any downfall below this support would have adversely affected the long-term trend of EWZ. However, with the bullish indications by the stochastic (14,3,3), the moving average convergence/divergence (MACD) should overcome the fear of further correction. |
| As you can see in Figure 1, the stochastic has formed a double bottom, which indicates that a fresh bullish rally may begin soon. And the MACD (12,26,9) had a bullish crossover, while the histogram shifted above the zero-line. This boosted the new upward move and thereafter there was no turnback for EWZ. The security went through a one-sided rally till the previous high resistance was hit back. Though a steep upside ralliy without a halt is risky, this rally was well-supported with healthy volume to continue its journey. The rally therefore had few strong supports below along with positive technical indications. |

|
| FIGURE 1: EWZ, DAILY. This chart of the Brazil iShares shows that the breakout has healthy signs to sustain. The MACD (12,26,9) is positive and ADX (14) is indicating a developing uptrend. The volumes are expanding as well, though the stochastic (14,3,3) is highly overbought. |
| Graphic provided by: StockCharts.com. |
| |
| So traders can initiate a fresh long position on this breakout with a stop-loss of 84. I would also like to grab your attention to the three white soldiers candlestick formation, which is likely to appear soon. The last two-day bullish session has formed two bullish candles and if EWZ goes through a strong upside rally on February 28, it would complete the formation and you may see trend reversal conditions. In addition, note that the average directional movement index (ADX) 14 has moved to 20 with the positive directional index (+DI), and therefore the uptrend is developing as well. |
| Those who are already on board can move their stop-loss to 82 to protect their profits and carry the position further. To measure the estimated level, we can calculate the approximate length of the steep rally; 86 - 70 = 16 is the length, and therefore, 86 + 16 = 102 would be the minimum level on the breakout. With the stochastic (14,3,3) being highly overbought, some shaky moves can be expected on the indicator and subsequently, the price may give some jerks. So traders should keep shifting the stop-losses and protect the profits. |
Active trader in the Indian stock markets since 2003 and a full-time writer. Trading is largely based upon technical analysis.
| Company: | Independent |
| Address: | C1/3 Parth Indraprasth Towers. Vastrapur |
| Ahmedabad, Guj 380015 | |
| E-mail address: | chaitalimohile@yahoo.co.in |
Traders' Resource Links | |
| Independent has not added any product or service information to TRADERS' RESOURCE. | |
Click here for more information about our publications!
Comments
Date: 03/03/08Rank: 5Comment:

Request Information From Our Sponsors
- StockCharts.com, Inc.
- Candle Patterns
- Candlestick Charting Explained
- Intermarket Technical Analysis
- John Murphy on Chart Analysis
- John Murphy's Chart Pattern Recognition
- John Murphy's Market Message
- MurphyExplainsMarketAnalysis-Intermarket Analysis
- MurphyExplainsMarketAnalysis-Visual Analysis
- StockCharts.com
- Technical Analysis of the Financial Markets
- The Visual Investor
- VectorVest, Inc.
- Executive Premier Workshop
- One-Day Options Course
- OptionsPro
- Retirement Income Workshop
- Sure-Fire Trading Systems (VectorVest, Inc.)
- Trading as a Business Workshop
- VectorVest 7 EOD
- VectorVest 7 RealTime/IntraDay
- VectorVest AutoTester
- VectorVest Educational Services
- VectorVest OnLine
- VectorVest Options Analyzer
- VectorVest ProGraphics v6.0
- VectorVest ProTrader 7
- VectorVest RealTime Derby Tool
- VectorVest Simulator
- VectorVest Variator
- VectorVest Watchdog
