HOT TOPICS LIST
- MACD
- Fibonacci
- RSI
- Gann
- ADXR
- Stochastics
- Volume
- Triangles
- Futures
- Cycles
- Volatility
- ZIGZAG
- MESA
- Retracement
- Aroon
INDICATORS LIST
LIST OF TOPICS
PRINT THIS ARTICLE
by Chaitali Mohile
$COMPQ is consolidating at the lowest support, forming a base with higher lows that may help accumulate some bullish strength.
Position: N/A
Chaitali Mohile
Active trader in the Indian stock markets since 2003 and a full-time writer. Trading is largely based upon technical analysis.
PRINT THIS ARTICLE
TECHNICAL ANALYSIS
NASDAQ Composite Forming A Bottom?
02/27/08 01:20:14 PMby Chaitali Mohile
$COMPQ is consolidating at the lowest support, forming a base with higher lows that may help accumulate some bullish strength.
Position: N/A
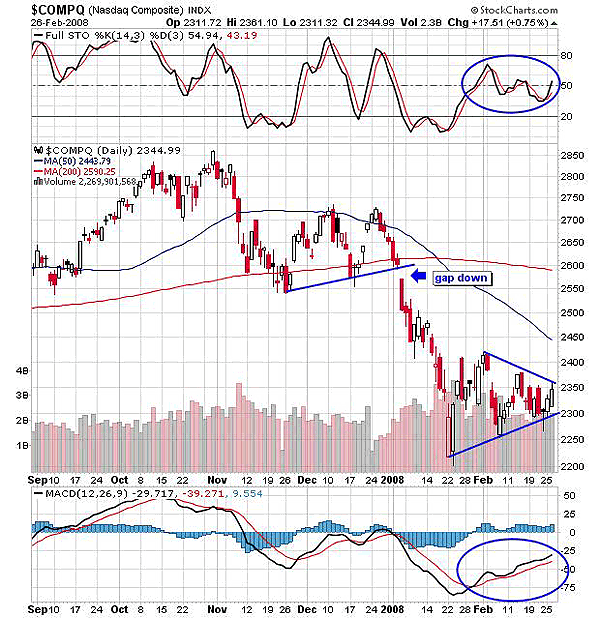
| Since November 2007 $COMPQ has been correcting, leaving behind various supports and losing 550-odd points from its highest point of 2850. Regaining the same level would be the ultimate target for the index. The support of a 200-day moving average was violated with a small gap down, bringing in a wide downfall that lasted for a few months. The bearish moving average crossover added the weakness for bulls and boosted the bears. The index then continued its bearish moves till the low, closer to 2200. The stochastic (14,3,3) was oversold for some time and so had strength to move in a bullish area, though it didn't turn in an overbought area. See Figure 1. |

|
| FIGURE 1: $COMPQ, DAILY. The range-bound movement is at its lowest support, forming a symmetrical triangle with stochastic (14,3,3) showing a zig-zag movement in the bullish area. The MACD (12,26,9) has a bullish crossover. |
| Graphic provided by: StockCharts.com. |
| |
| The momentum indicator faced resistance around 50 to 60 levels and therefore witnessed directionless movement. But one thing is clear from the indicator: The index is not in the mood to drift below the bullish area. As a result, the price formed a higher low with long bullish candles and also lower highs, but with small red candles. So from such a move, traders can note that some bullish strength is accumulating with this sideway consolidation. A symmetrical triangle looks to be forming with this consolidating move. This gives the thought of a bottom formation as the correction has turned sideways with no further fall. |
| Though we cannot identify the breakout level, traders can stay watchful of the index and the technology equities. The moving average convergence/divergence MACD (12,26,9) is positive after a bullish crossover in negative territory. This does not indicate that bulls are back, but only says that bears are likely to lose their momentum. So we can expect that bottom formation may continue, which will bring positive sentiment back. |

|
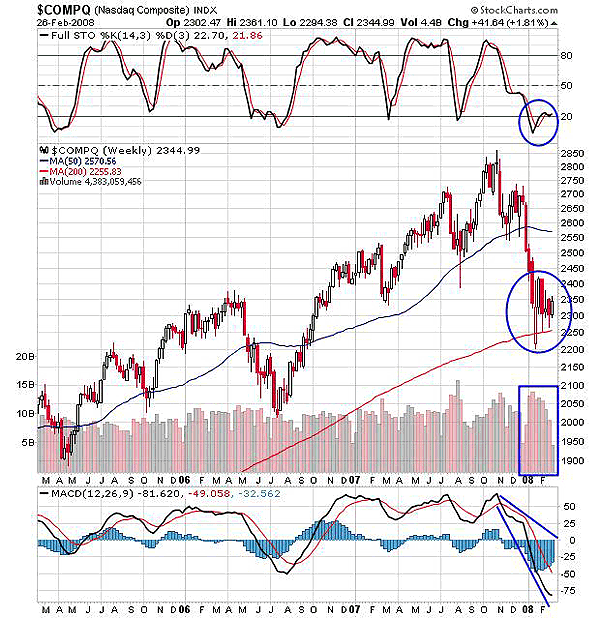
| FIGURE 2: $COMPQ, WEEKLY. The index has established support on the long-term moving average that is a 200-day moving average support. |
| Graphic provided by: StockCharts.com. |
| |
| The weekly chart in Figure 2 shows that $COMPQ has rested on the ultimate support of the 200-day moving average, which is considered the most important support to determine the trend variation. The index with this support has surged marginally for a month and a half. The stochastic (14,3,3) is mingling above the 20 level, indicating the possibility of consolidation at lower levels (the indicator can turn flat for a longer period as well). The MACD (12,26,9) is still in negative territory, suggesting that weakness may still persist. Therefore, Figure 2 has a mixed view but the 200-day MA support has been established and may lead to consolidation too. And both the charts together identify the lower-level consolidation or range-bound move, which we could say is a bottom formation. |
Active trader in the Indian stock markets since 2003 and a full-time writer. Trading is largely based upon technical analysis.
| Company: | Independent |
| Address: | C1/3 Parth Indraprasth Towers. Vastrapur |
| Ahmedabad, Guj 380015 | |
| E-mail address: | chaitalimohile@yahoo.co.in |
Traders' Resource Links | |
| Independent has not added any product or service information to TRADERS' RESOURCE. | |
Click here for more information about our publications!
Comments
Date: 02/28/08Rank: 4Comment:

Request Information From Our Sponsors
- VectorVest, Inc.
- Executive Premier Workshop
- One-Day Options Course
- OptionsPro
- Retirement Income Workshop
- Sure-Fire Trading Systems (VectorVest, Inc.)
- Trading as a Business Workshop
- VectorVest 7 EOD
- VectorVest 7 RealTime/IntraDay
- VectorVest AutoTester
- VectorVest Educational Services
- VectorVest OnLine
- VectorVest Options Analyzer
- VectorVest ProGraphics v6.0
- VectorVest ProTrader 7
- VectorVest RealTime Derby Tool
- VectorVest Simulator
- VectorVest Variator
- VectorVest Watchdog
- StockCharts.com, Inc.
- Candle Patterns
- Candlestick Charting Explained
- Intermarket Technical Analysis
- John Murphy on Chart Analysis
- John Murphy's Chart Pattern Recognition
- John Murphy's Market Message
- MurphyExplainsMarketAnalysis-Intermarket Analysis
- MurphyExplainsMarketAnalysis-Visual Analysis
- StockCharts.com
- Technical Analysis of the Financial Markets
- The Visual Investor
