HOT TOPICS LIST
- MACD
- Fibonacci
- RSI
- Gann
- ADXR
- Stochastics
- Volume
- Triangles
- Futures
- Cycles
- Volatility
- ZIGZAG
- MESA
- Retracement
- Aroon
INDICATORS LIST
LIST OF TOPICS
PRINT THIS ARTICLE
by Jason K. Hutson
Use support and resistance zones to define possible trading ranges. Once identified, these ranges can be very helpful when trading any type of equity.
Position: Buy
Jason K. Hutson
Traders.com Staff Writer. Enjoys trendlines, support and resistance, moving averages, RSI, MACD, ADX, Bollinger bands, parabolic SAR, chart formations, and volume analysis.
PRINT THIS ARTICLE
TREND-CHANNEL
Trading Range Bounce for Symantec Corp. [SYMC]
03/12/01 11:06:52 AMby Jason K. Hutson
Use support and resistance zones to define possible trading ranges. Once identified, these ranges can be very helpful when trading any type of equity.
Position: Buy
| Placing trades around support and resistance areas can help minimize risk and increase the likelihood of trading success. The theory behind support and resistance relates to supply and demand. By looking at a price chart of an equity, you can spot areas of either high demand (support areas), or high supply (resistance areas). |
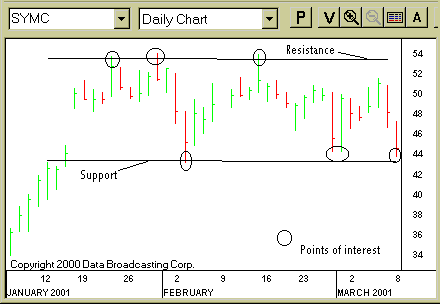
| The chart below shows the daily high, low and closing prices of Symantec Corporation [SYMC]. Notice that over the past two months a trading range has formed between $45 and $55. A line connecting the bottom points of interest on the chart creates the $45 support level. A line connecting the upper points of interest on the chart creates the $55 resistance level. Points of interest are defined as isolated highs and lows. |

|
| On this daily chart of Symantec, the points of interest have been circled. The upper points are possible selling areas and the lower points, possible buying areas. |
| Graphic provided by: eSignal. |
| |
| Interpret areas of support or resistance as areas where there is a higher likelihood that buyers or sellers will step up to the plate and change the current direction of the price trend. These areas of support and resistance can also aid in placing stop-loss orders to help minimize the overall risk of a trade. Support and resistance areas are not exact, and the longer they exist the less valid they become. |
| When you see a trading range, you can buy at the bottom of the range and place a stop underneath the support. You can also sell short at the top of the range and place a stop above the resistance level. |
Traders.com Staff Writer. Enjoys trendlines, support and resistance, moving averages, RSI, MACD, ADX, Bollinger bands, parabolic SAR, chart formations, and volume analysis.
| Title: | Industrial Engineer |
| Company: | Technical Analysis, Inc. |
| Address: | 4757 California Ave SW |
| Seattle, WA 98116 | |
| Phone # for sales: | 206 938 0570 |
| Website: | Traders.com |
| E-mail address: | JasonHutson@Traders.com |
Traders' Resource Links | |
| Charting the Stock Market: The Wyckoff Method -- Books | |
| Working-Money.com -- Online Trading Services | |
| Traders.com Advantage -- Online Trading Services | |
| Technical Analysis of Stocks & Commodities -- Publications and Newsletters | |
| Working Money, at Working-Money.com -- Publications and Newsletters | |
| Traders.com Advantage -- Publications and Newsletters | |
| Professional Traders Starter Kit -- Software | |
Click here for more information about our publications!
Comments

Request Information From Our Sponsors
- VectorVest, Inc.
- Executive Premier Workshop
- One-Day Options Course
- OptionsPro
- Retirement Income Workshop
- Sure-Fire Trading Systems (VectorVest, Inc.)
- Trading as a Business Workshop
- VectorVest 7 EOD
- VectorVest 7 RealTime/IntraDay
- VectorVest AutoTester
- VectorVest Educational Services
- VectorVest OnLine
- VectorVest Options Analyzer
- VectorVest ProGraphics v6.0
- VectorVest ProTrader 7
- VectorVest RealTime Derby Tool
- VectorVest Simulator
- VectorVest Variator
- VectorVest Watchdog
- StockCharts.com, Inc.
- Candle Patterns
- Candlestick Charting Explained
- Intermarket Technical Analysis
- John Murphy on Chart Analysis
- John Murphy's Chart Pattern Recognition
- John Murphy's Market Message
- MurphyExplainsMarketAnalysis-Intermarket Analysis
- MurphyExplainsMarketAnalysis-Visual Analysis
- StockCharts.com
- Technical Analysis of the Financial Markets
- The Visual Investor
