HOT TOPICS LIST
- MACD
- Fibonacci
- RSI
- Gann
- ADXR
- Stochastics
- Volume
- Triangles
- Futures
- Cycles
- Volatility
- ZIGZAG
- MESA
- Retracement
- Aroon
INDICATORS LIST
LIST OF TOPICS
PRINT THIS ARTICLE
by Chaitali Mohile
The volatility has turned wild as this stock started to trade in a narrower range, experiencing choppy trading sessions.
Position: N/A
Chaitali Mohile
Active trader in the Indian stock markets since 2003 and a full-time writer. Trading is largely based upon technical analysis.
PRINT THIS ARTICLE
VOLATILITY
Pfizer Trading In Narrow Range
02/27/08 12:19:07 PMby Chaitali Mohile
The volatility has turned wild as this stock started to trade in a narrower range, experiencing choppy trading sessions.
Position: N/A
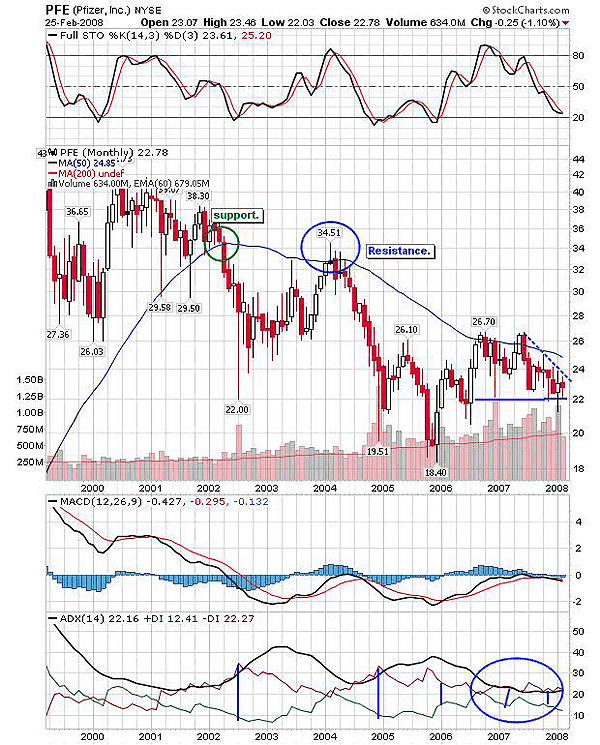
| Pfizer (PFE) has been in a downtrend since 2001. Earlier, though the stock was entering a downtrend, there were various selling opportunities as the trading range was fairly broad. But over time, the range turned narrower and highly volatile. In Figure 1, the average directional movement index moved closer to the 20 level with weak buying pressure as the ADX (14) went through fast recovery and the bear took control of the trend. The vertical lines on the ADX (14) show how the distance between the +DI and -DI was reduced with every passing year. And currently there is hardly any space left between the two DIs. This suggests high volatility with a narrowing trading gap. |

|
| FIGURE 1: PFIZER, MONTHLY. The 50-day MA support was converted to resistance, leading to further downfall. Eventually, the triangular formation shows the narrow range-bound moves. The distance between DI+ and DI- also points to the volatile action. |
| Graphic provided by: StockCharts.com. |
| |
| Violating the 50-day moving average support reconfirmed that the fresh downtrend is under way. The support, converted to resistance, was rechecked by the stock but bears were already in action, so the stock failed to cross the resistance from below. Traders gained confidence in building short positions and the volume on the charts indicates the same picture. The selling side was getting stronger till the range was tradable. Later, in 2006 with a low of 18.40, some buyers took positions, increasing the choppiness in trading. The 50-day moving average resistance still persists, making lower highs and stable lows. The triangular formation awaits the breakout as the formation has moved in a narrower range. |
| Of the other two indicators, the stochastic (14,3,3) is close to being oversold and could signal a breakout, while the moving average convergence/divergence (MACD) (12,26,9) also shows volatility as though it is near the zero line, appearing to be reluctant to surge to a positive area. Therefore, the long-term chart points to a volatile narrow trading range, which may persist until some concrete move is indicated. |

|
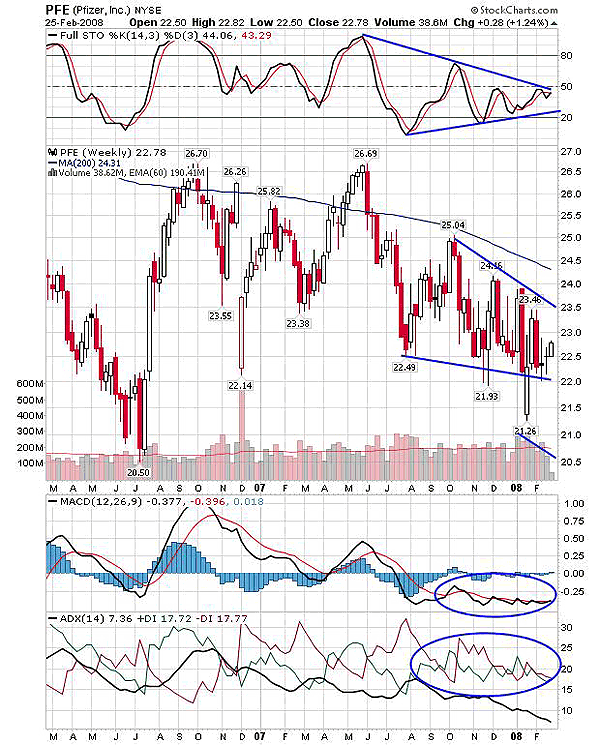
| FIGURE 2: PFIZER, WEEKLY. The trading volume has gradually reduced with lower highs and lower lows in the stock. |
| Graphic provided by: StockCharts.com. |
| |
| The weekly chart seen in Figure 2 gives an idea of choppiness during the trading session. In Figure 2, a 200-day moving average is the strongest resistance and leaves bearish signs on the chart. Various attempts were made by the stock to violate the resistance but failed, resulting in lower lows and lower highs. The long shadows of the candles are one more indication of volatility and fears amid the traders. The upper trendline would be the potential resistance followed by 200-day MA resistance, whereas the lower trendline would act as a strong support during these periods. |
| The stochastic (14,3,3) shows a symmetrical triangle formed due to lower highs and higher lows, and anticipating the breakout of this formation is risky. So a breakout on either side would lead to a directional price movement. The MACD (12,26,9) too shows snaky moves around the trigger line so that again points toward continued volatility. And the ADX (14) is very weak with no signs of any particular trend-following. So an overall view on either chart suggests that the stock is still weak and likely to trade in a narrow range with high volatility. High-risk takers now have only a two-point trading gap, which may whipsaw them. |
Active trader in the Indian stock markets since 2003 and a full-time writer. Trading is largely based upon technical analysis.
| Company: | Independent |
| Address: | C1/3 Parth Indraprasth Towers. Vastrapur |
| Ahmedabad, Guj 380015 | |
| E-mail address: | chaitalimohile@yahoo.co.in |
Traders' Resource Links | |
| Independent has not added any product or service information to TRADERS' RESOURCE. | |
Click here for more information about our publications!
PRINT THIS ARTICLE

Request Information From Our Sponsors
- StockCharts.com, Inc.
- Candle Patterns
- Candlestick Charting Explained
- Intermarket Technical Analysis
- John Murphy on Chart Analysis
- John Murphy's Chart Pattern Recognition
- John Murphy's Market Message
- MurphyExplainsMarketAnalysis-Intermarket Analysis
- MurphyExplainsMarketAnalysis-Visual Analysis
- StockCharts.com
- Technical Analysis of the Financial Markets
- The Visual Investor
- VectorVest, Inc.
- Executive Premier Workshop
- One-Day Options Course
- OptionsPro
- Retirement Income Workshop
- Sure-Fire Trading Systems (VectorVest, Inc.)
- Trading as a Business Workshop
- VectorVest 7 EOD
- VectorVest 7 RealTime/IntraDay
- VectorVest AutoTester
- VectorVest Educational Services
- VectorVest OnLine
- VectorVest Options Analyzer
- VectorVest ProGraphics v6.0
- VectorVest ProTrader 7
- VectorVest RealTime Derby Tool
- VectorVest Simulator
- VectorVest Variator
- VectorVest Watchdog
