HOT TOPICS LIST
- MACD
- Fibonacci
- RSI
- Gann
- ADXR
- Stochastics
- Volume
- Triangles
- Futures
- Cycles
- Volatility
- ZIGZAG
- MESA
- Retracement
- Aroon
INDICATORS LIST
LIST OF TOPICS
PRINT THIS ARTICLE
by Mike Carr, CMT
Long before a bankruptcy filing, the stock of Sharper Image showed signs of trouble for the retailer.
Position: Sell
Mike Carr, CMT
Mike Carr, CMT, is a member of the Market Technicians Association, and editor of the MTA's newsletter, Technically Speaking. He is also the author of "Smarter Investing in Any Economy: The Definitive Guide to Relative Strength Investing," and "Conquering the Divide: How to Use Economic Indicators to Catch Stock Market Trends."
PRINT THIS ARTICLE
STRATEGIES
The Market Knew Sharper Image Was In Trouble
02/25/08 02:59:01 PMby Mike Carr, CMT
Long before a bankruptcy filing, the stock of Sharper Image showed signs of trouble for the retailer.
Position: Sell
| Sharper Image (SHRP) has shown that being the dominant retailer in the market for ionic air purifiers isn't enough to keep a company, or a stock, afloat. The company is known for being one of the best suppliers for high-end electronic gadgets that you never knew you needed. Unfortunately for SHRP, consumers never created a lot of demand for these gadgets, and the company filed for bankruptcy after years of struggling to find a profitable business model. |
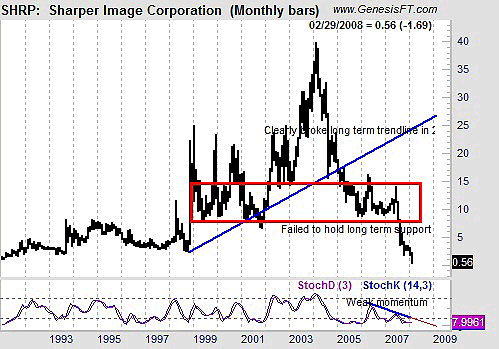
| The stock has long been trending lower. And no technician should have had any reason to own this stock for several years. It is difficult to find any bullish argument in the monthly chart shown in Figure 1. The upward sloping trendline was broken in 2005, at the same time a head & shoulders top formed. In 2007, the stock broke through a support zone that had held for 10 years. Combined with the stochastics divergence, no trader should have been looking at this stock. |

|
| FIGURE 1: SHRP, MONTHLY. Here, the Sharper Image stock is filled with warning signs of a further downside. |
| Graphic provided by: Trade Navigator. |
| |
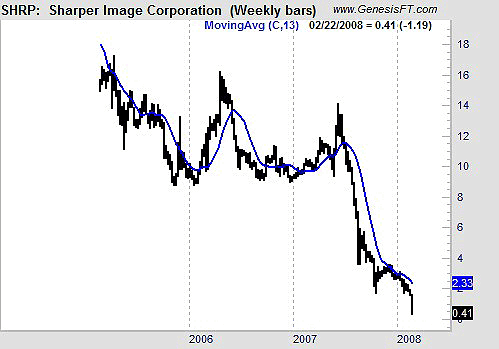
| The weekly chart (Figure 2) shows that the stock broke below its 13-week moving average in 2007, and the stock has fallen steadily ever since. This moving average, about three months in length, offers a good indication of the intermediate-term trend in SHRP, and in many other stocks. |

|
| FIGURE 2: SHRP, WEEKLY. A 13-week moving average on a weekly chart often gives timely buy and sell signals. |
| Graphic provided by: Trade Navigator. |
| |
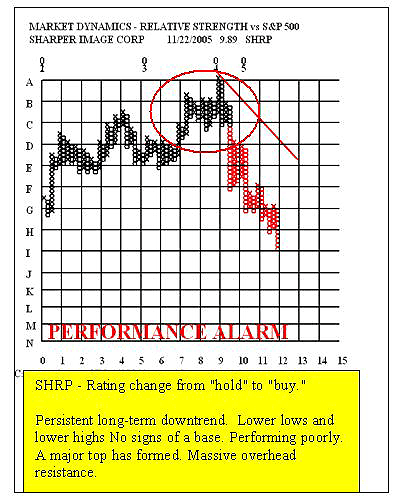
| Finally, a point & figure chart of the long-term relative strength (Figure 3) shows that the stock was lagging the market even as brokerage analysts were upgrading it based upon fundamentals. An analyst raised his rating on SHRP in November 2005 to buy. The chart from that time, provided by market analyst Clay Allen, shows that SHRP had already been in a downtrend for more than two years. |

|
| FIGURE 3: SHRP, P&F. Relative strength was lagging the market for more than two years as analysts were recommending SHRP. It continued lower. |
| Graphic provided by: Market Dynamics. |
| |
| Long-term technical analysis is probably the best tool a trader can use for avoiding disasters such as SHRP. The trend is your friend, and even short-term traders need to look at the charts from longer time frames. |
Mike Carr, CMT, is a member of the Market Technicians Association, and editor of the MTA's newsletter, Technically Speaking. He is also the author of "Smarter Investing in Any Economy: The Definitive Guide to Relative Strength Investing," and "Conquering the Divide: How to Use Economic Indicators to Catch Stock Market Trends."
| Website: | www.moneynews.com/blogs/MichaelCarr/id-73 |
| E-mail address: | marketstrategist@gmail.com |
Click here for more information about our publications!
Comments
Date: 02/25/08Rank: 4Comment:
Date: 02/26/08Rank: 4Comment:

Request Information From Our Sponsors
- StockCharts.com, Inc.
- Candle Patterns
- Candlestick Charting Explained
- Intermarket Technical Analysis
- John Murphy on Chart Analysis
- John Murphy's Chart Pattern Recognition
- John Murphy's Market Message
- MurphyExplainsMarketAnalysis-Intermarket Analysis
- MurphyExplainsMarketAnalysis-Visual Analysis
- StockCharts.com
- Technical Analysis of the Financial Markets
- The Visual Investor
- VectorVest, Inc.
- Executive Premier Workshop
- One-Day Options Course
- OptionsPro
- Retirement Income Workshop
- Sure-Fire Trading Systems (VectorVest, Inc.)
- Trading as a Business Workshop
- VectorVest 7 EOD
- VectorVest 7 RealTime/IntraDay
- VectorVest AutoTester
- VectorVest Educational Services
- VectorVest OnLine
- VectorVest Options Analyzer
- VectorVest ProGraphics v6.0
- VectorVest ProTrader 7
- VectorVest RealTime Derby Tool
- VectorVest Simulator
- VectorVest Variator
- VectorVest Watchdog
