

HOT TOPICS LIST
- MACD
- Fibonacci
- RSI
- Gann
- ADXR
- Stochastics
- Volume
- Triangles
- Futures
- Cycles
- Volatility
- ZIGZAG
- MESA
- Retracement
- Aroon
INDICATORS LIST
LIST OF TOPICS
PRINT THIS ARTICLE
by Arthur Hill
After forming a bearish engulfing pattern at resistance, Research In Motion looks ripe for a move down.
Position: Sell
Arthur Hill
Arthur Hill is currently editor of TDTrader.com, a website specializing in trading strategies, sector/industry specific breadth stats and overall technical analysis. He passed the Society of Technical Analysts (STA London) diploma exam with distinction is a Certified Financial Technician (CFTe). Prior to TD Trader, he was the Chief Technical Analyst for Stockcharts.com and the main contributor to the ChartSchool.
PRINT THIS ARTICLE
CANDLESTICK CHARTING
RIMM Hits Resistance
02/20/08 03:49:34 PMby Arthur Hill
After forming a bearish engulfing pattern at resistance, Research In Motion looks ripe for a move down.
Position: Sell
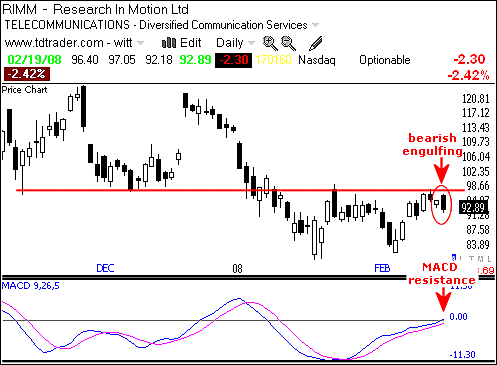
| Figure 1 shows daily candlesticks for Research In Motion (RIMM). Candlesticks work well for daily prices because they emphasize price action after the open. The open acts as a starting point and it is important what happens after the open. Black candlesticks show when the close is below the open and the white candlesticks show when the open is above the close. Long black candlesticks show intense selling pressure, while long white candlestick shows strong buying pressure. |
| On the price chart, RIMM broke support with a sharp decline in January. Broken support turns into resistance and the stock met resistance at 100 in late January. After another dip and bounce in February, the stock is once again trading near resistance around 100. Note that RIMM opened strong on February 19 and closed weak to form a long black candlestick (red oval). This candlestick completely engulfed the prior white candlestick and this affirms resistance. With resistance confirmed, the odds favor a move lower. |
|
| FIGURE 1: RIMM, DAILY. RIMM broke support with a sharp decline in January. |
| Graphic provided by: TeleChart2007. |
| |
| The moving average convergence/divergence (MACD) also hits resistance. The bottom indicator window shows MACD, and this momentum indicator recently moved back into positive territory. While that may seem, well, positive, the zero area could actually act as resistance when the overall trend is down. A move below the signal line (pink) would trigger a MACD sell signal. |
|
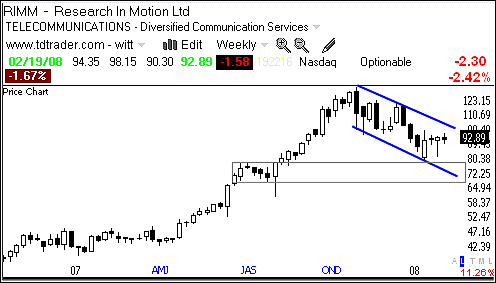
| FIGURE 2: RIMM, WEEKLY. See the clear downtrend over the last few months. |
| Graphic provided by: TeleChart2007. |
| |
| Figure 2 shows weekly prices and a clear downtrend over the last few months. The gray rectangle shows a support zone and the downside target is to the mid-70s. |
Arthur Hill is currently editor of TDTrader.com, a website specializing in trading strategies, sector/industry specific breadth stats and overall technical analysis. He passed the Society of Technical Analysts (STA London) diploma exam with distinction is a Certified Financial Technician (CFTe). Prior to TD Trader, he was the Chief Technical Analyst for Stockcharts.com and the main contributor to the ChartSchool.
| Title: | Editor |
| Company: | TDTrader.com |
| Address: | Willem Geetsstraat 17 |
| Mechelen, B2800 | |
| Phone # for sales: | 3215345465 |
| Website: | www.tdtrader.com |
| E-mail address: | arthurh@tdtrader.com |
Traders' Resource Links | |
| TDTrader.com has not added any product or service information to TRADERS' RESOURCE. | |
Click here for more information about our publications!
Comments
Date:�02/21/08Rank:�3Comment:�

Request Information From Our Sponsors
- StockCharts.com, Inc.
- Candle Patterns
- Candlestick Charting Explained
- Intermarket Technical Analysis
- John Murphy on Chart Analysis
- John Murphy's Chart Pattern Recognition
- John Murphy's Market Message
- MurphyExplainsMarketAnalysis-Intermarket Analysis
- MurphyExplainsMarketAnalysis-Visual Analysis
- StockCharts.com
- Technical Analysis of the Financial Markets
- The Visual Investor
- VectorVest, Inc.
- Executive Premier Workshop
- One-Day Options Course
- OptionsPro
- Retirement Income Workshop
- Sure-Fire Trading Systems (VectorVest, Inc.)
- Trading as a Business Workshop
- VectorVest 7 EOD
- VectorVest 7 RealTime/IntraDay
- VectorVest AutoTester
- VectorVest Educational Services
- VectorVest OnLine
- VectorVest Options Analyzer
- VectorVest ProGraphics v6.0
- VectorVest ProTrader 7
- VectorVest RealTime Derby Tool
- VectorVest Simulator
- VectorVest Variator
- VectorVest Watchdog