HOT TOPICS LIST
- MACD
- Fibonacci
- RSI
- Gann
- ADXR
- Stochastics
- Volume
- Triangles
- Futures
- Cycles
- Volatility
- ZIGZAG
- MESA
- Retracement
- Aroon
INDICATORS LIST
LIST OF TOPICS
PRINT THIS ARTICLE
by Chaitali Mohile
An interesting reversal candlestick pattern was formed on the weekly chart of Microsoft, plunging the stock back to its lows.
Position: N/A
Chaitali Mohile
Active trader in the Indian stock markets since 2003 and a full-time writer. Trading is largely based upon technical analysis.
PRINT THIS ARTICLE
CANDLESTICK CHARTING
Effect Of Evening Doji Star
02/26/08 02:32:15 PMby Chaitali Mohile
An interesting reversal candlestick pattern was formed on the weekly chart of Microsoft, plunging the stock back to its lows.
Position: N/A
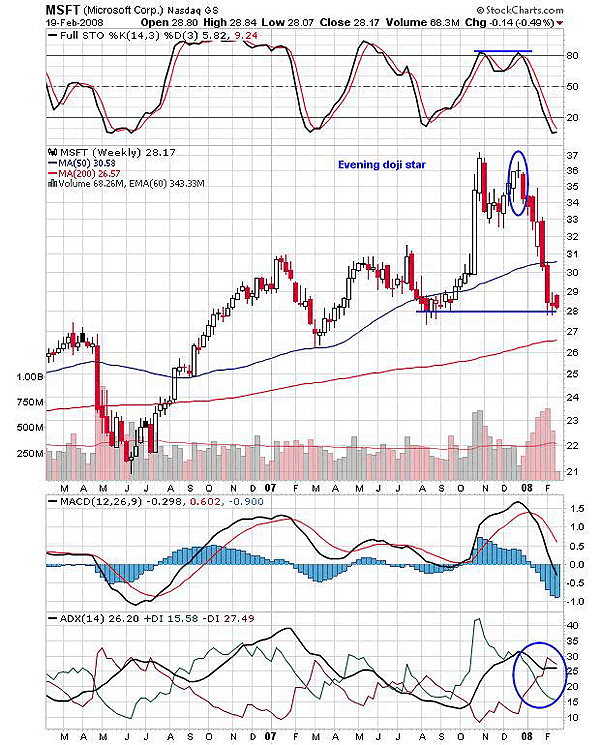
| The evening star and evening doji star are two reversal candlestick patterns, the difference being a middle candle formation. Both formations are a top reversal pattern, but the evening doji star is seen as a major warning before the darkness. The doji star formed in the middle of first bullish candle of the earlier trend, and the third bearish candle makes all the difference. The evening star has a small real body in the middle. Microsoft (MSFT) reached its high of 37 in October, which it could hardly sustain and thereby corrected. The stock tried to regain the strength and surge back to its previous high. Meanwhile, the stochastic (14,3,3) formed a double top. And the doji candle reflects bulls running out of confidence around 36 as the strength dried up. |

|
| FIGURE 1: MSFT, DAILY. The evening doji star has resulted in a serious correction, hitting the potential support area. The MACD and ADX are still indicating weakness, whereas stochastic has been oversold. |
| Graphic provided by: StockCharts.com. |
| |
| The stock weakened further as the third candle was formed, completing the major reversal pattern of the evening doji star. The stock gave a good chance to go short below 34, first with minimum downside of a 50-day moving average support. The stock continued its downward journey, losing more points every week and violating even the important support of the moving average. That indicated a high-bearish pressure, and why not? Many good technology stocks are either range-bound waiting for a good opportunity to break out or still under negative pressure. MSFT can now establish a support near a previous support area. |
| The stock may also enter consolidation with this support (which could be healthier, as drifting further would bring MSFT close to its 200-day MA support) as the stochastic (14,3,3) is already oversold and may move flat before climbing the bullish area. However, the moving average convergence/divergence (MACD) (12,26,9) is still negative and more likely to slip in negative territory, and the average directional movement index (ADX) (14) shows a negative directional index is turning out stronger over the positive directional index. So the bears may take over the hold soon. |
| The stock may test its lowest support of the 200-day MA in the worst case. Until some bullish sign occurs on the chart, the evening doji star would be the ruling star. Hence, consolidation at the current level is essential to prevent further damage. |
Active trader in the Indian stock markets since 2003 and a full-time writer. Trading is largely based upon technical analysis.
| Company: | Independent |
| Address: | C1/3 Parth Indraprasth Towers. Vastrapur |
| Ahmedabad, Guj 380015 | |
| E-mail address: | chaitalimohile@yahoo.co.in |
Traders' Resource Links | |
| Independent has not added any product or service information to TRADERS' RESOURCE. | |
Click here for more information about our publications!
Comments
Date: 02/27/08Rank: 3Comment:

Request Information From Our Sponsors
- StockCharts.com, Inc.
- Candle Patterns
- Candlestick Charting Explained
- Intermarket Technical Analysis
- John Murphy on Chart Analysis
- John Murphy's Chart Pattern Recognition
- John Murphy's Market Message
- MurphyExplainsMarketAnalysis-Intermarket Analysis
- MurphyExplainsMarketAnalysis-Visual Analysis
- StockCharts.com
- Technical Analysis of the Financial Markets
- The Visual Investor
- VectorVest, Inc.
- Executive Premier Workshop
- One-Day Options Course
- OptionsPro
- Retirement Income Workshop
- Sure-Fire Trading Systems (VectorVest, Inc.)
- Trading as a Business Workshop
- VectorVest 7 EOD
- VectorVest 7 RealTime/IntraDay
- VectorVest AutoTester
- VectorVest Educational Services
- VectorVest OnLine
- VectorVest Options Analyzer
- VectorVest ProGraphics v6.0
- VectorVest ProTrader 7
- VectorVest RealTime Derby Tool
- VectorVest Simulator
- VectorVest Variator
- VectorVest Watchdog
